Investment Presentation Strategy PowerPoint Template – Sleek Design for Funding Acquisition
M0500001
- Last Update 01/16/2025
- File Size 39.7MB
- # of Slides 30
- File Format PPTX
- Slide Ratio 16:9
- Color
Slide Preview
Keywords
About the Product
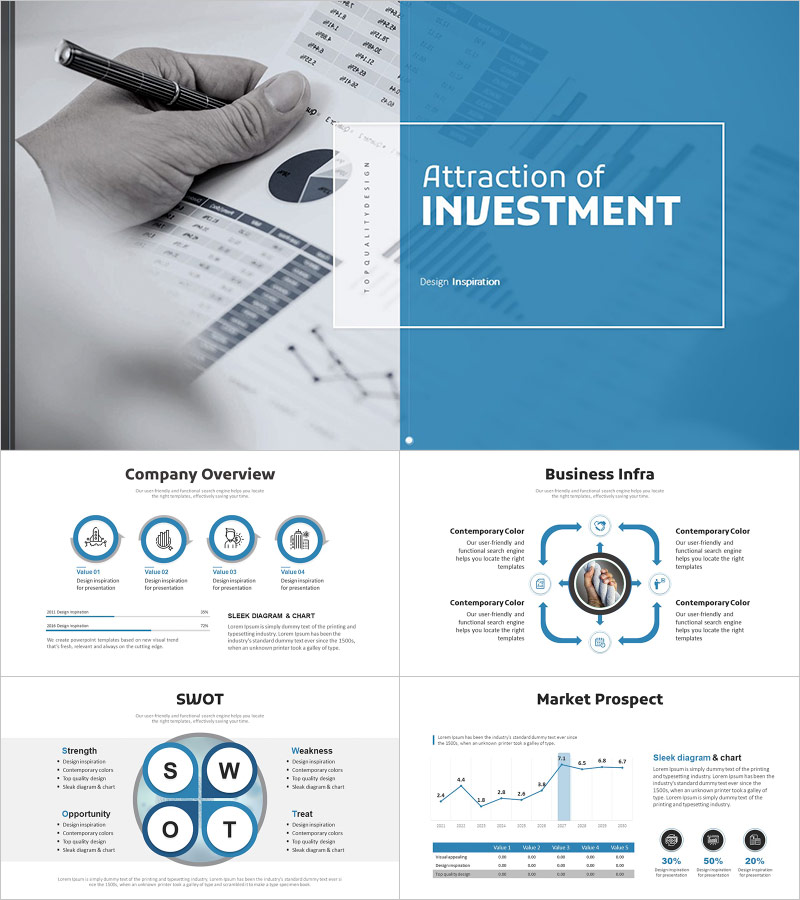
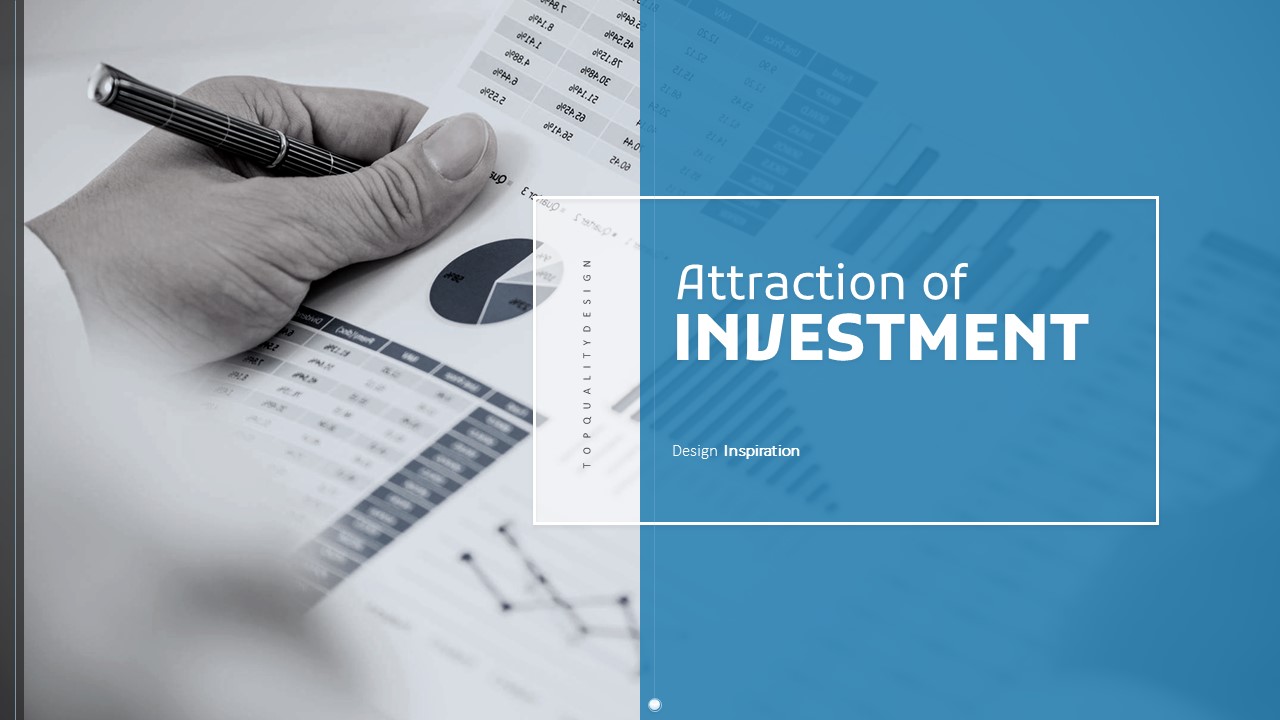
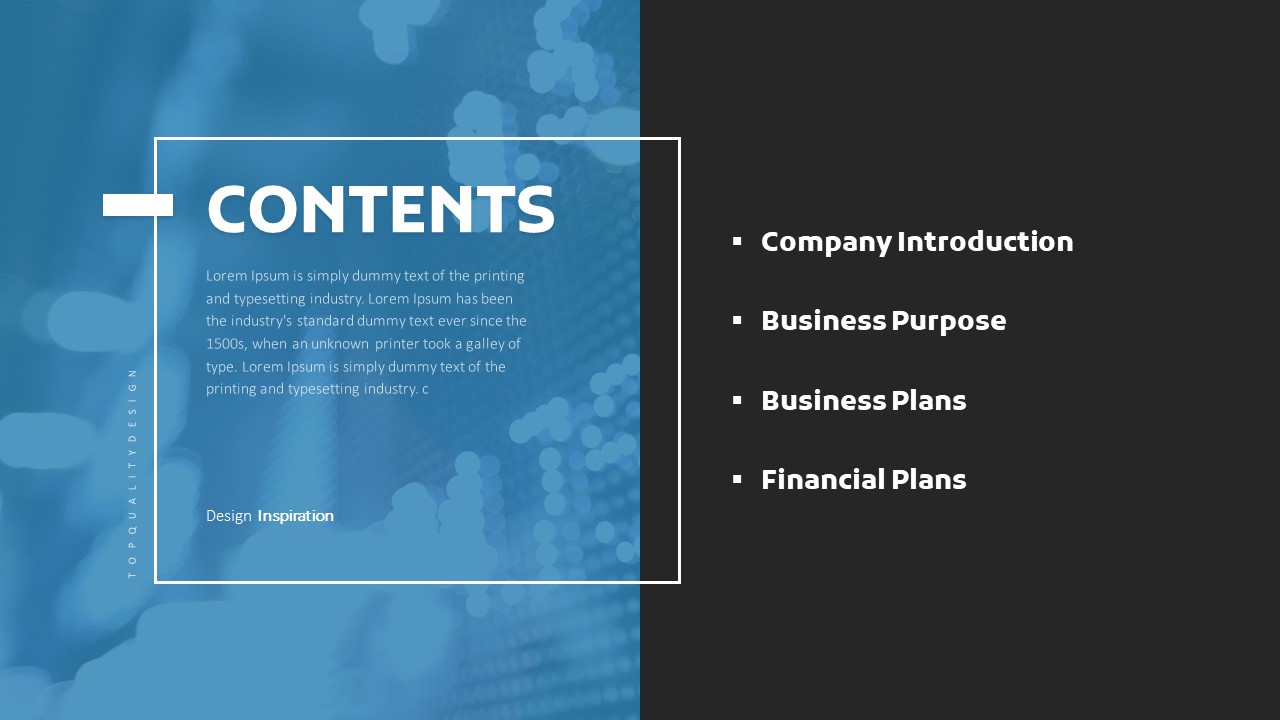
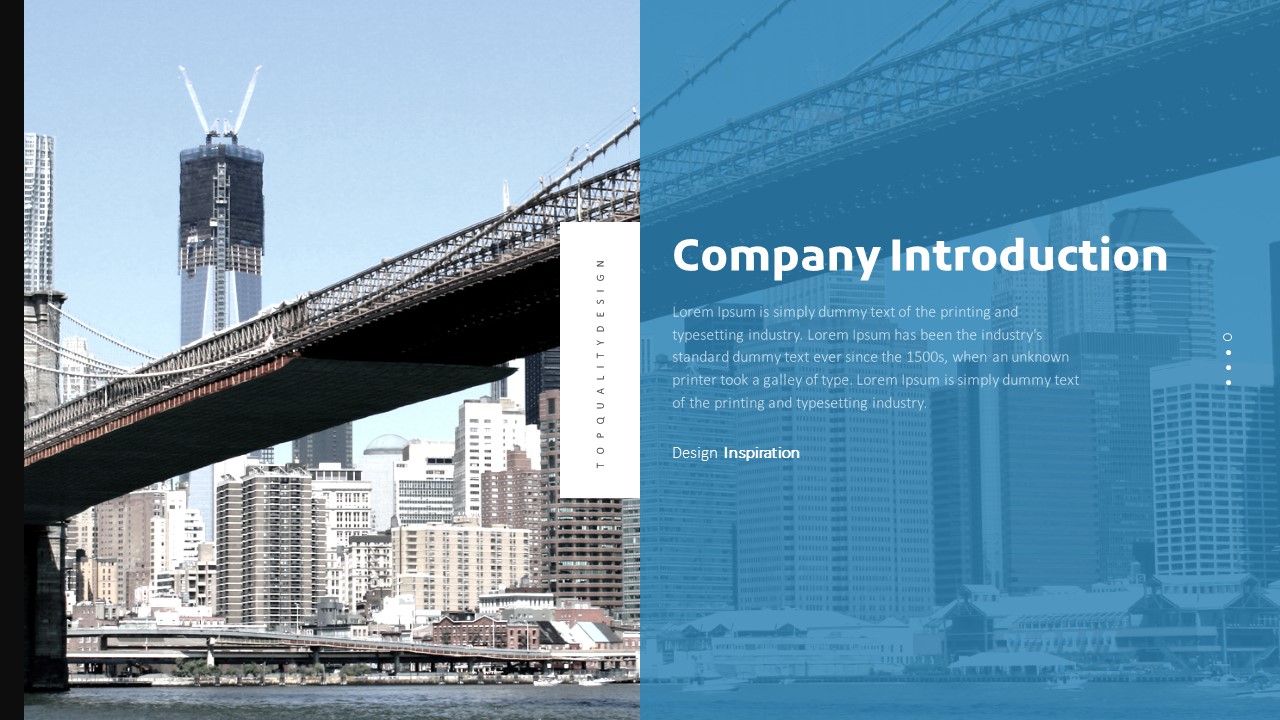
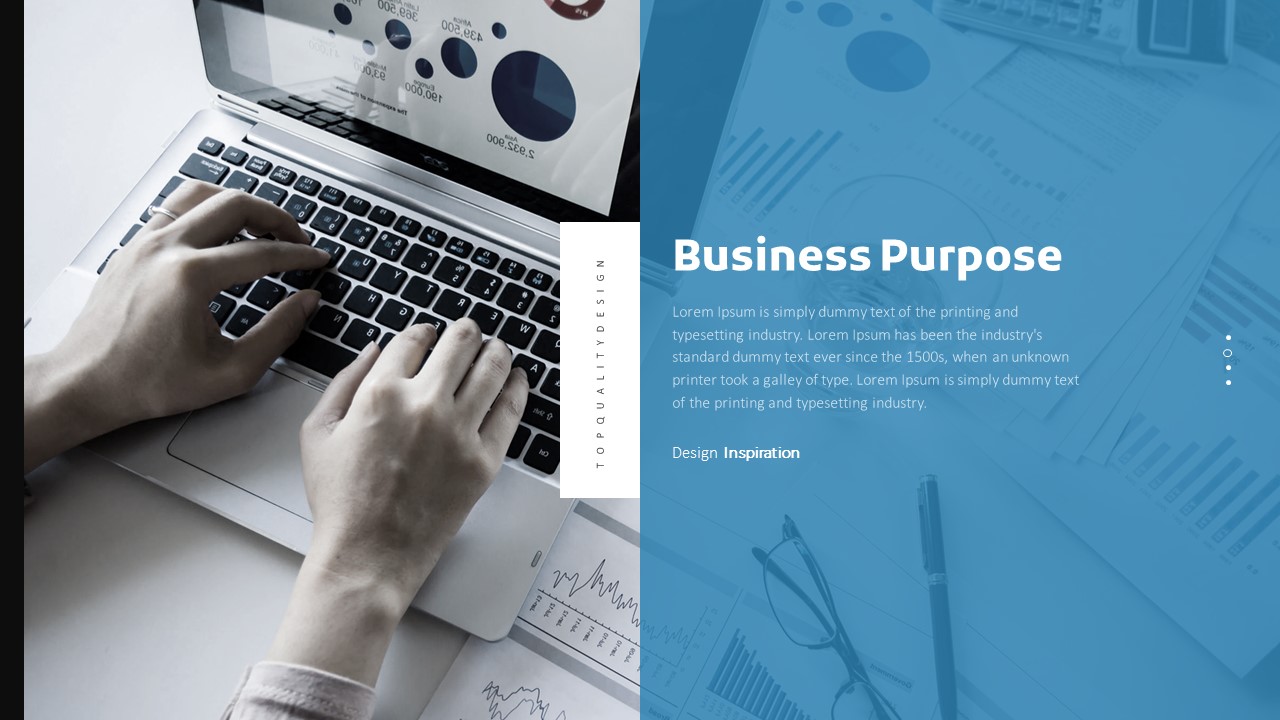
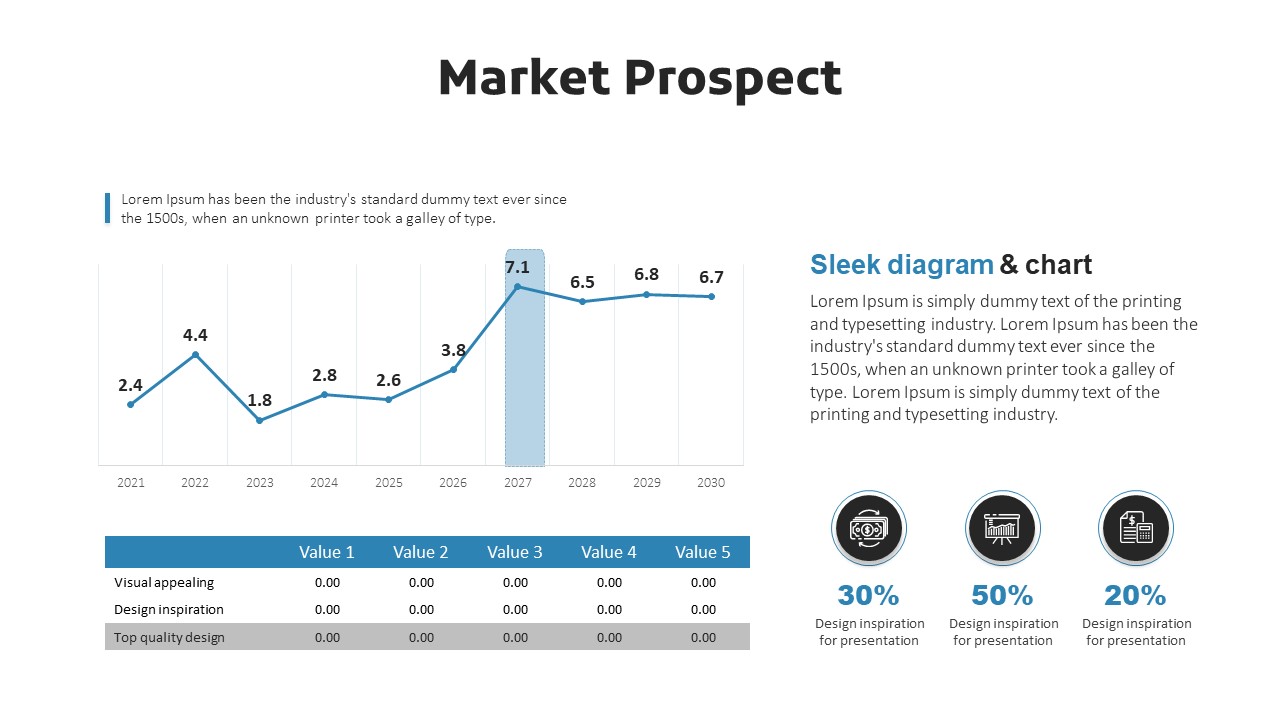
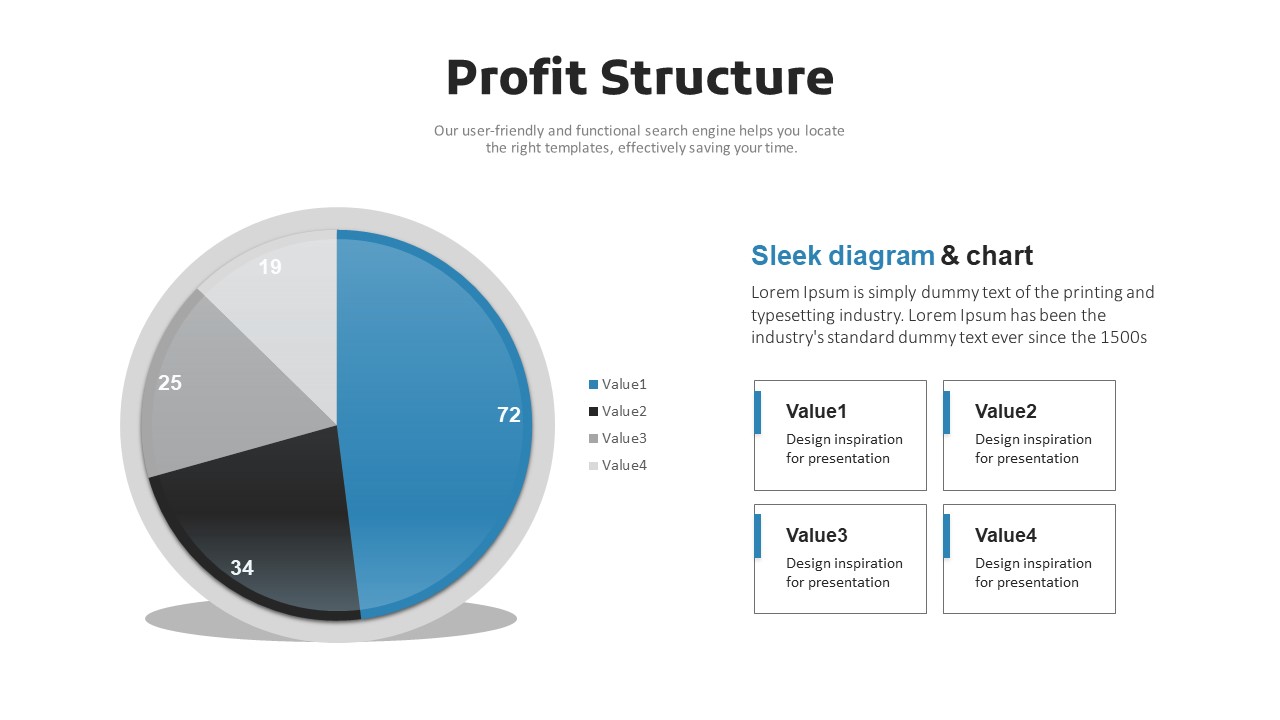
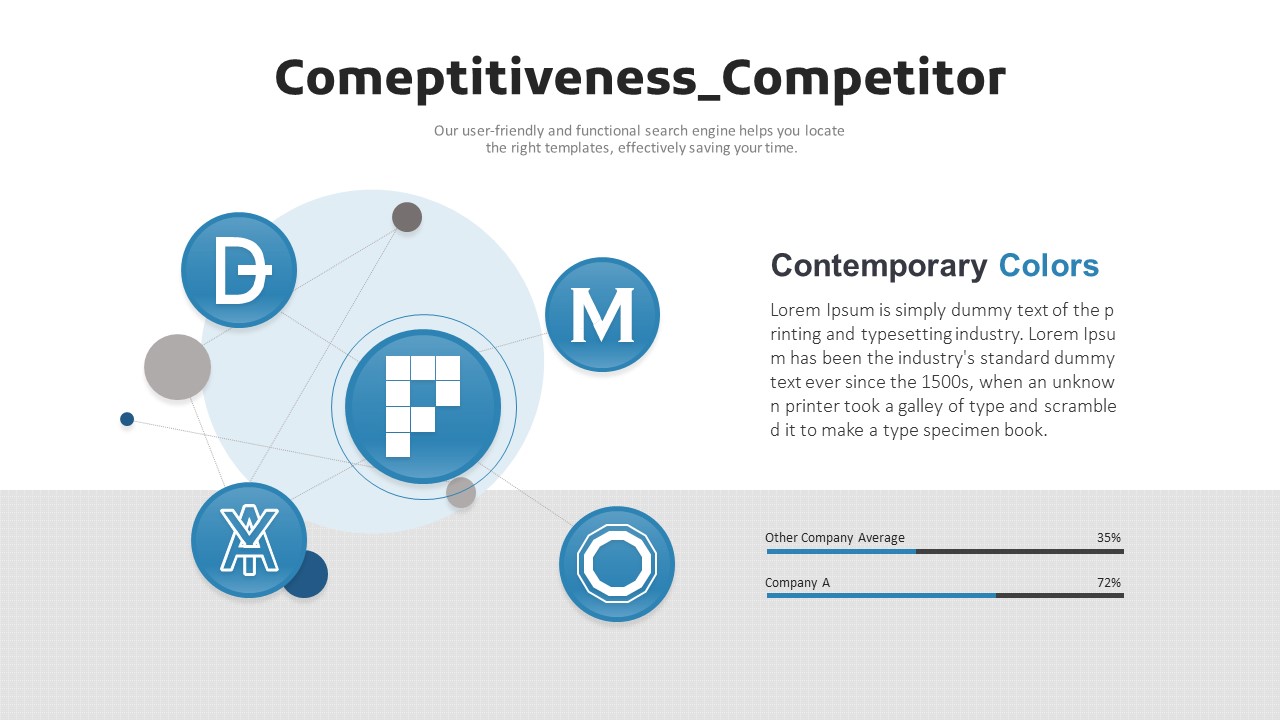
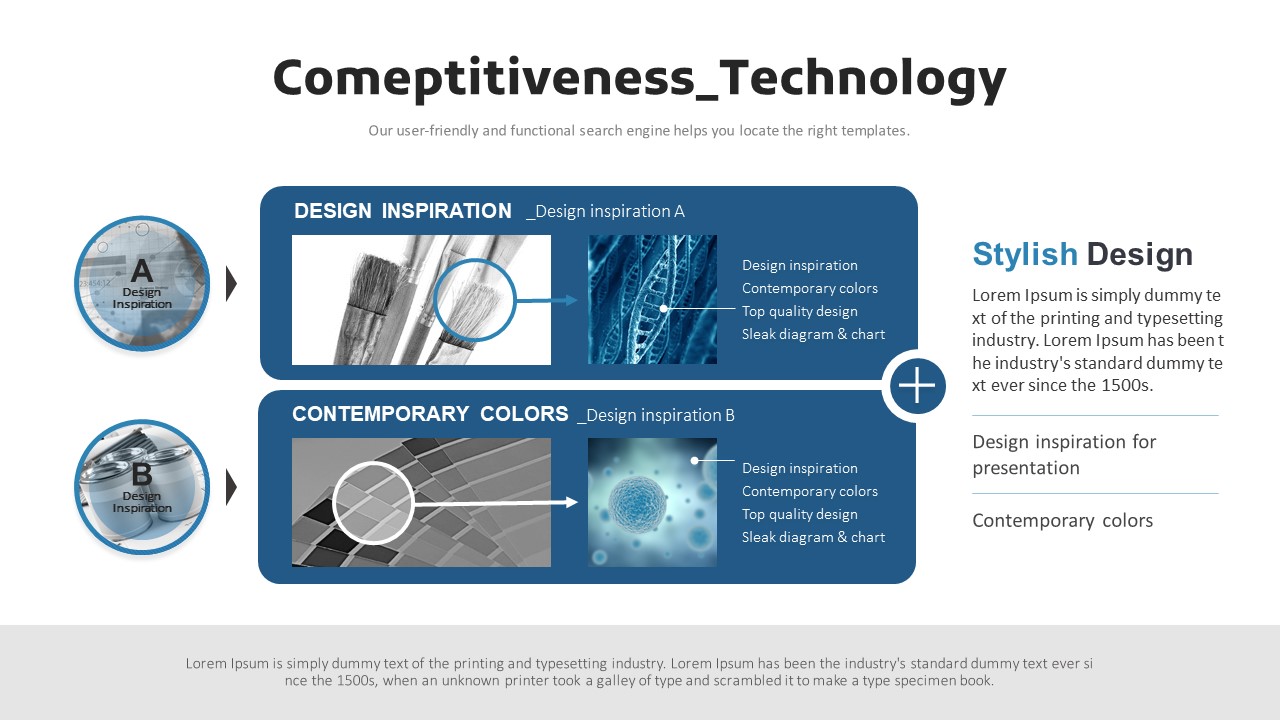
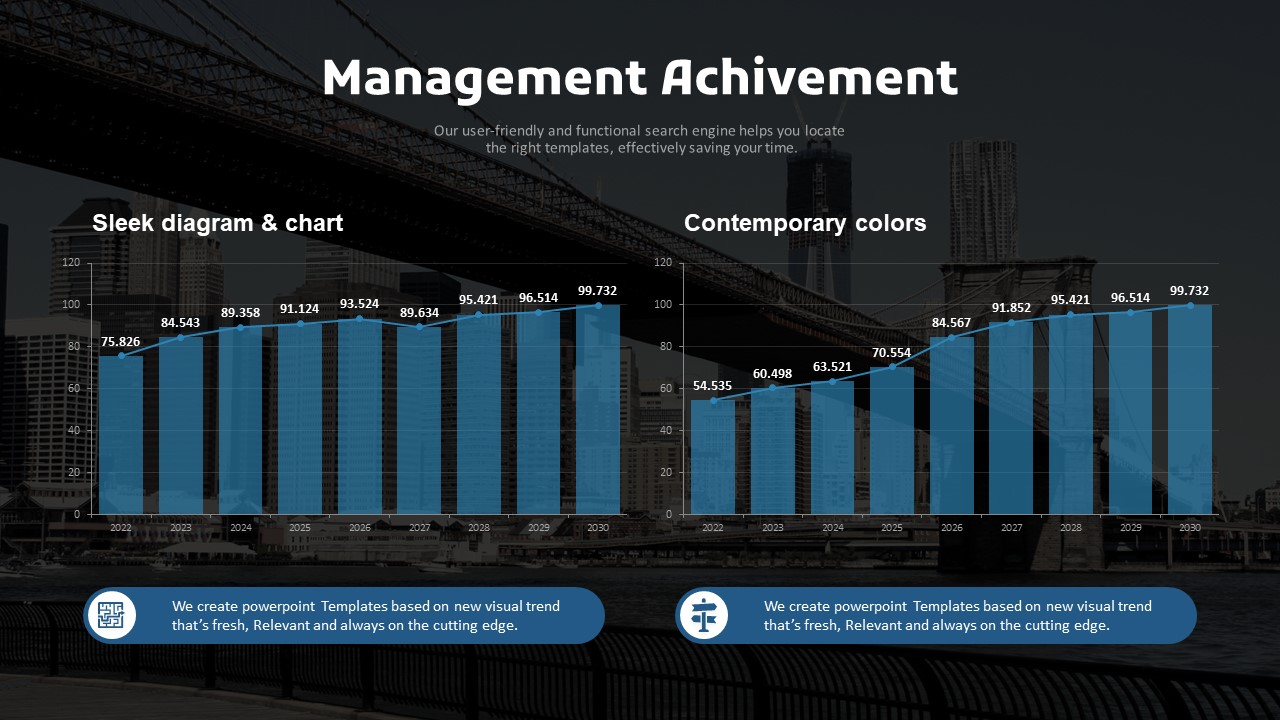
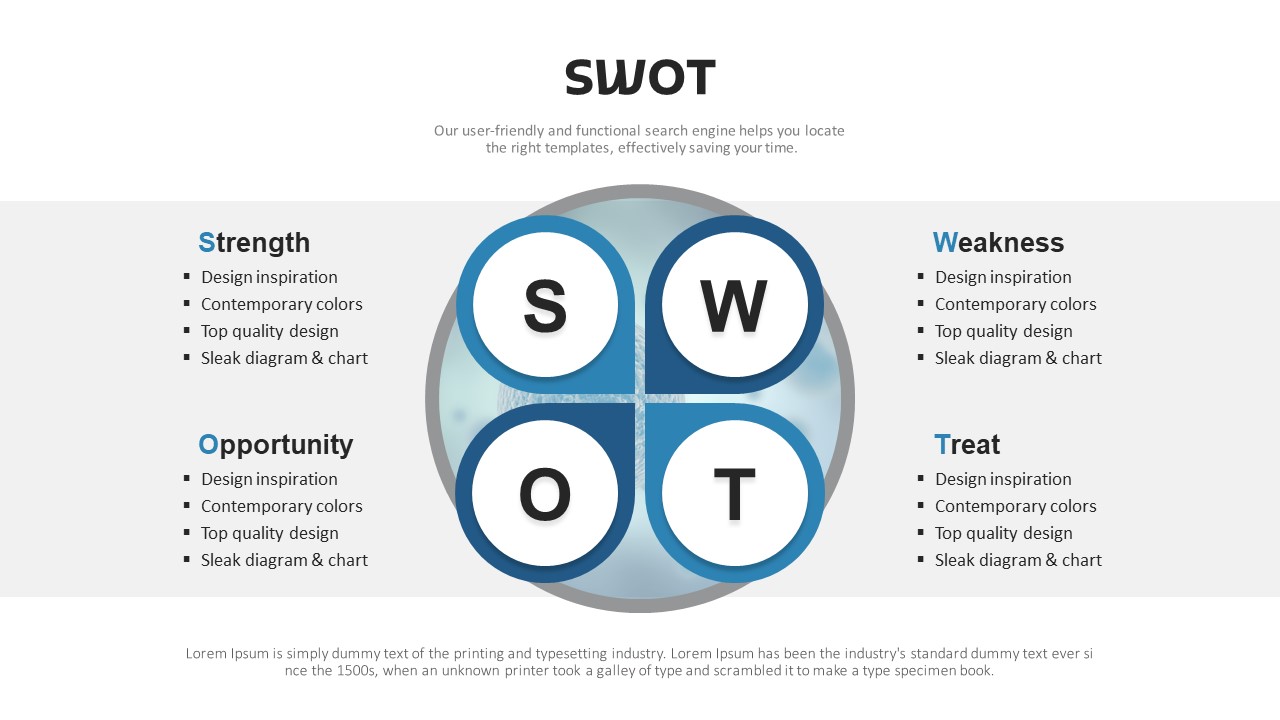
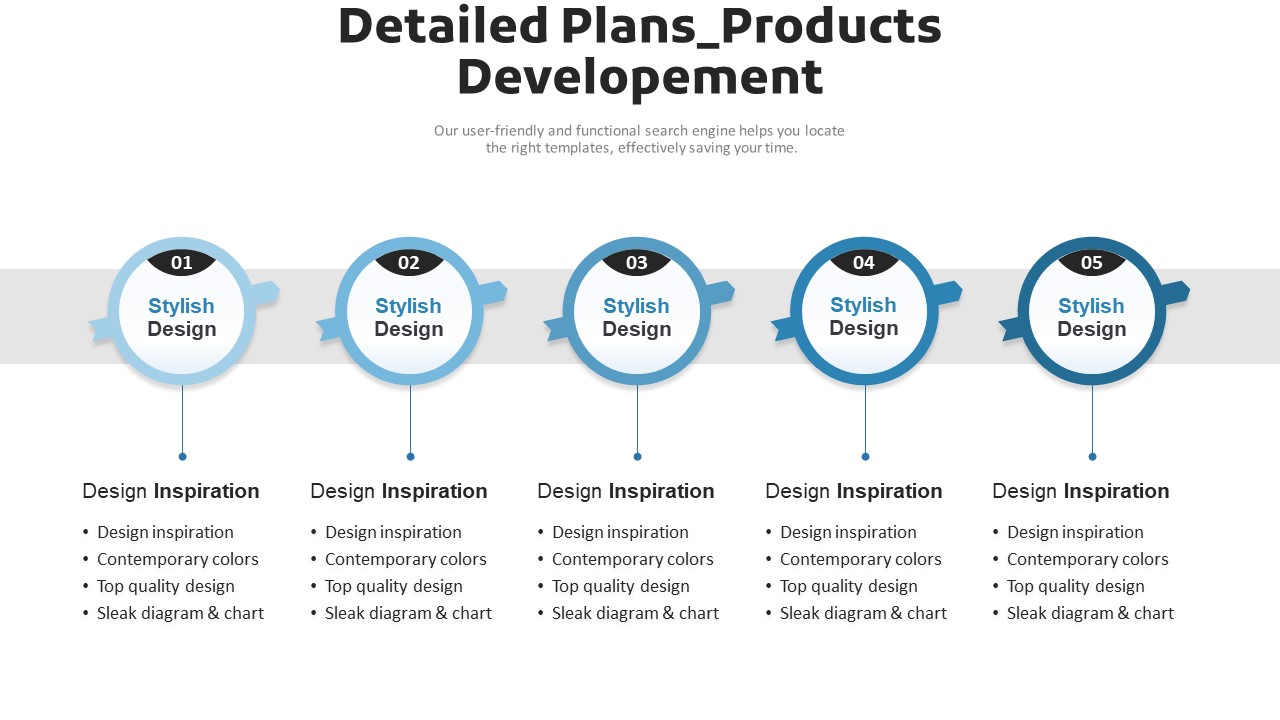
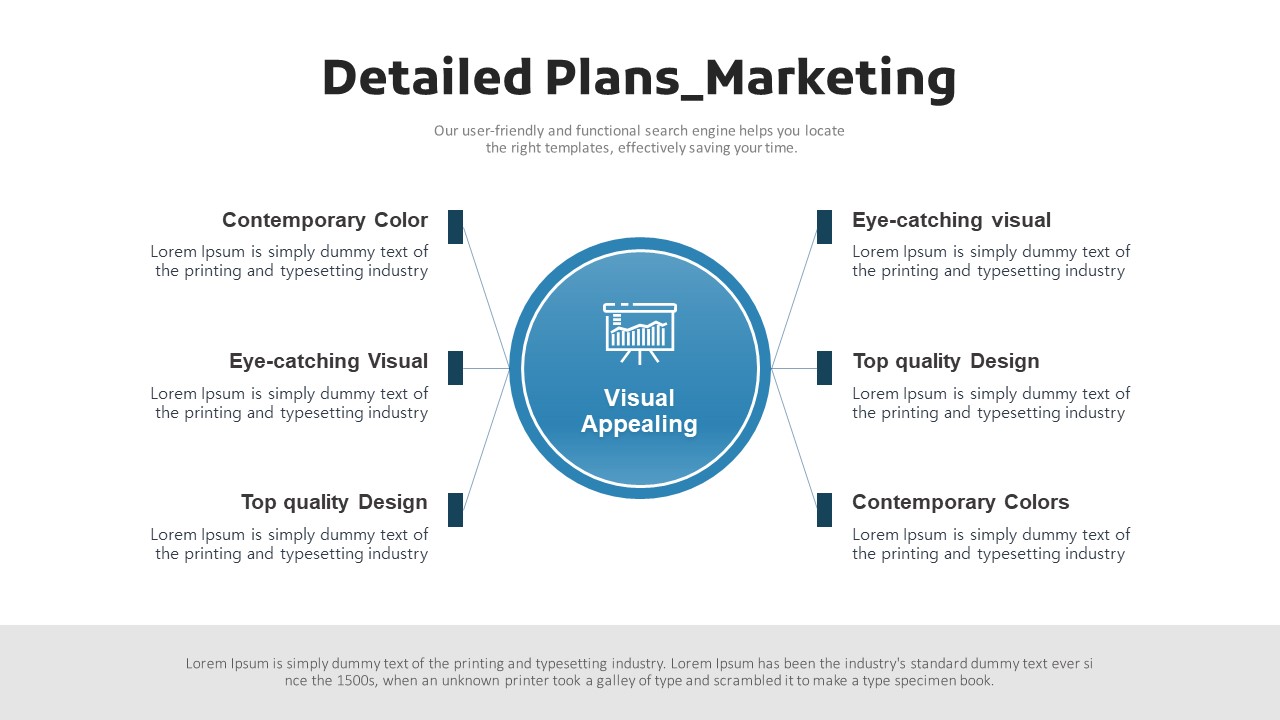
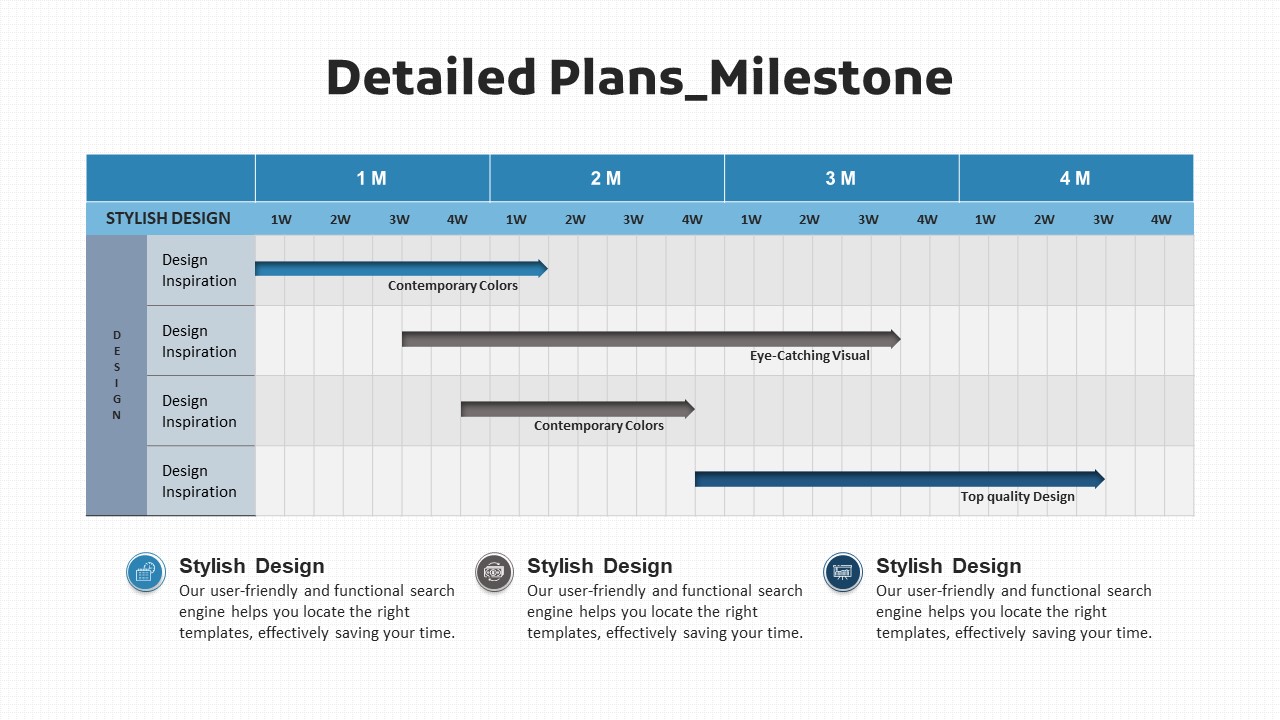
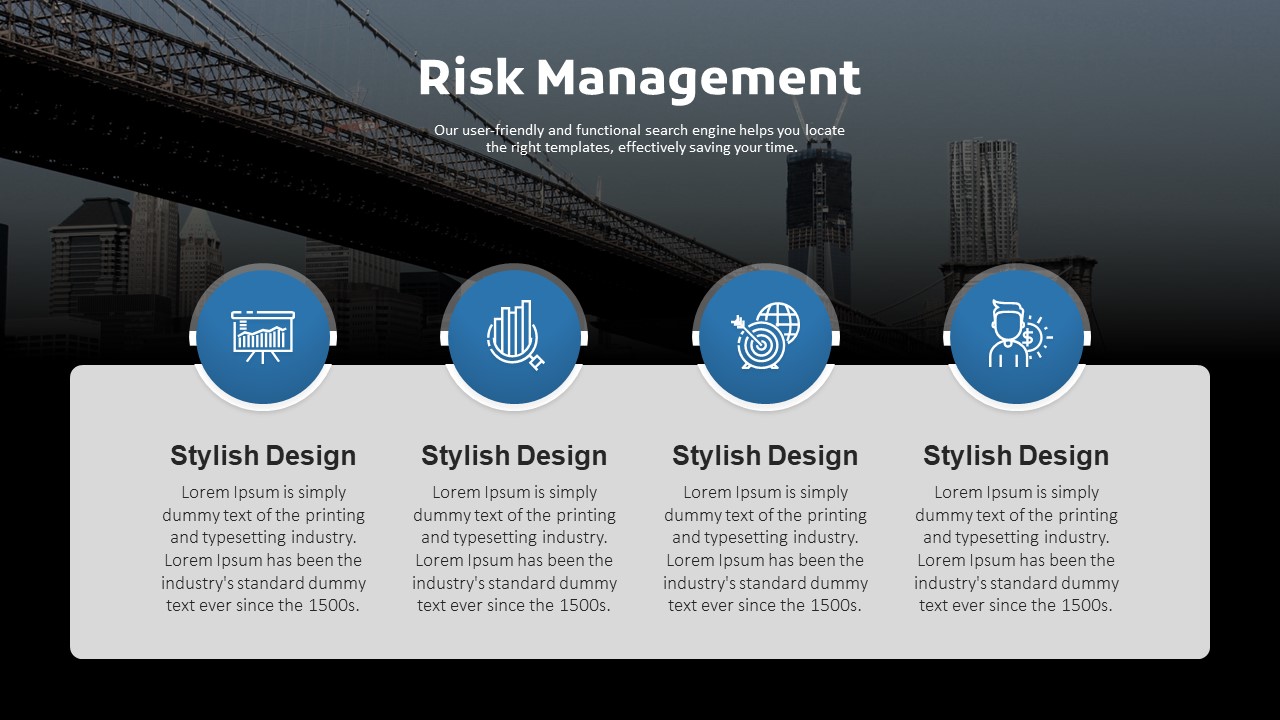
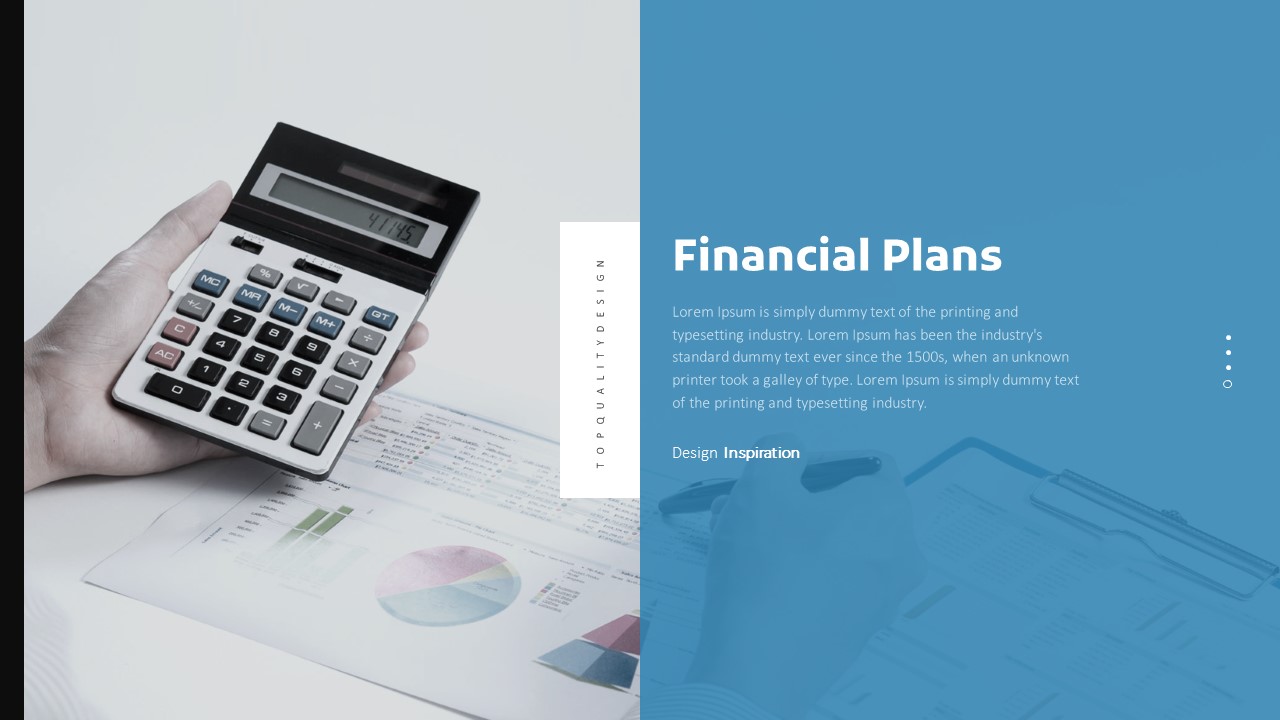
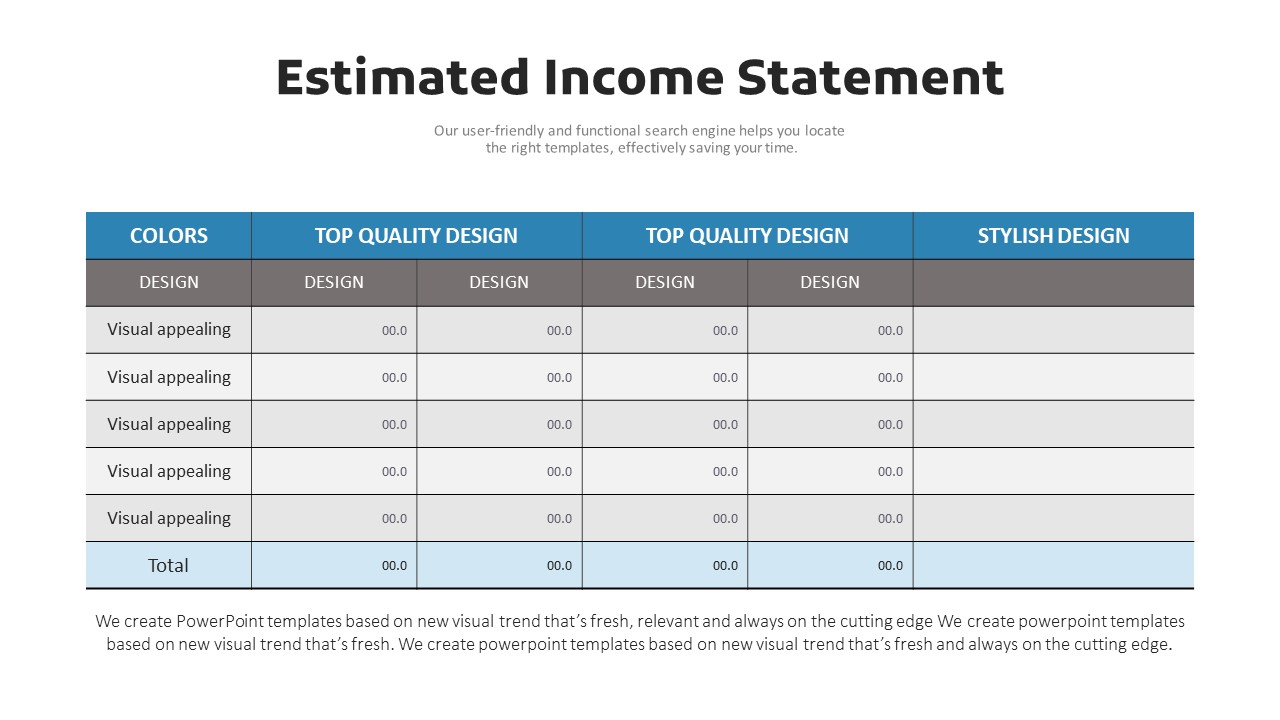
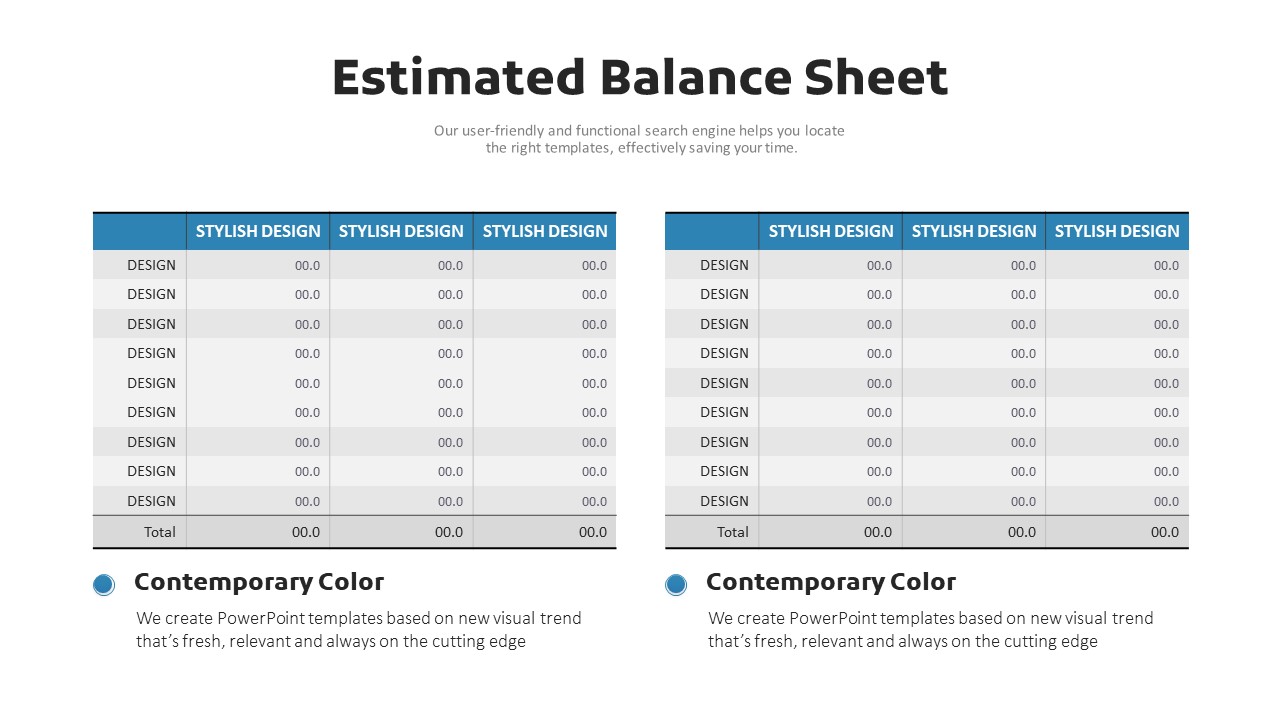
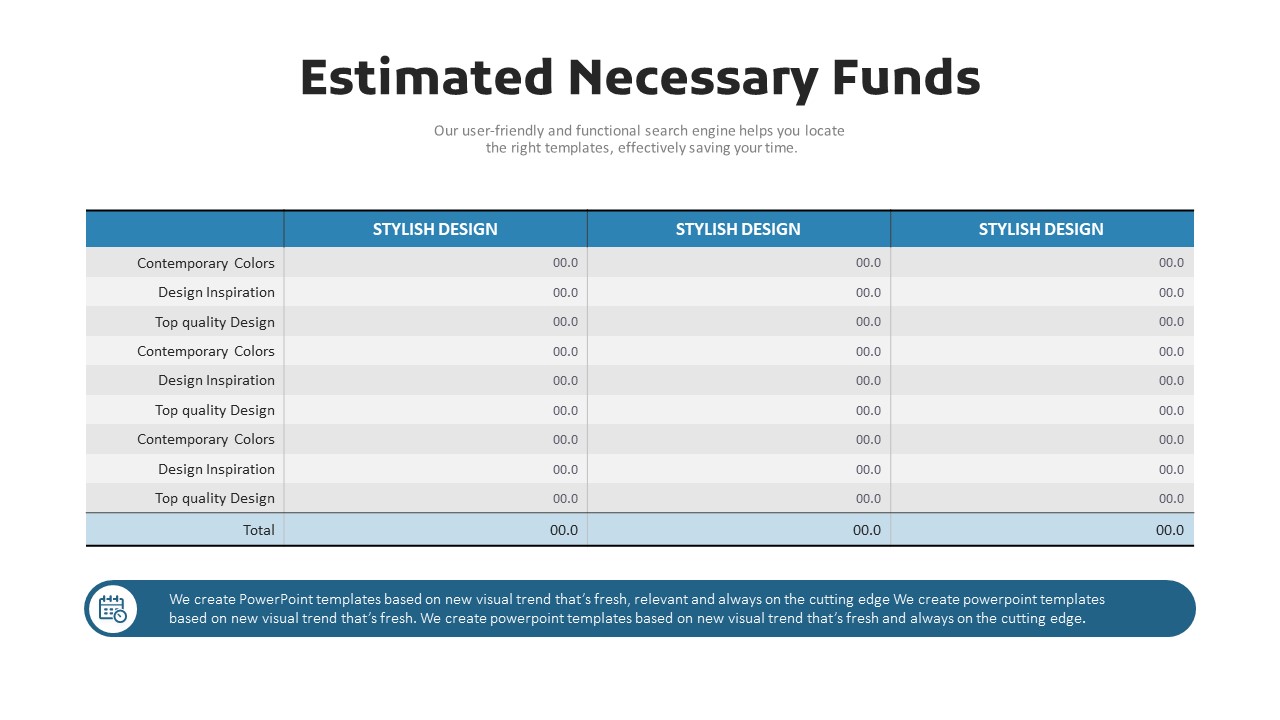
A professional investor presentation PowerPoint template designed to persuade investors and review committees. Built on a blue and dark charcoal two-tone color scheme, this pitch deck delivers credibility and authority through white-background slides accented with blue lines and circular icon badges that clearly define information hierarchy. The 30-slide set follows a standard pitch deck structure across four core sections: Company Introduction, Business Purpose, Business Plans, and Financial Plans. Visualization slides include a SWOT four-quadrant analysis, circular process diagram, line graph with data table, and percentage infographics—everything needed to make a compelling investment case. Delivered as an editable PPTX file, each slide is ready to customize in PowerPoint with your own data and content.
Usage Points
-
Main Usage
Designed for startups and SMEs preparing investor pitches, funding rounds, or IR presentations. The template covers all sections investors expect—company overview, business model, market analysis, and financial projections—in a structured, professional slide deck format.
-
How to Use
Replace the placeholder text and figures in each of the four sections (Company Introduction, Business Purpose, Business Plans, Financial Plans). Input your actual data into the SWOT quadrant, line graph, and data table slides to instantly produce a polished investor-ready presentation.
-
Recommended For
Startup founders and CFOs preparing Series A/B funding rounds, corporate managers presenting to government grant committees, and entrepreneurs heading into venture capital or angel investor meetings.
-
Slide Structure
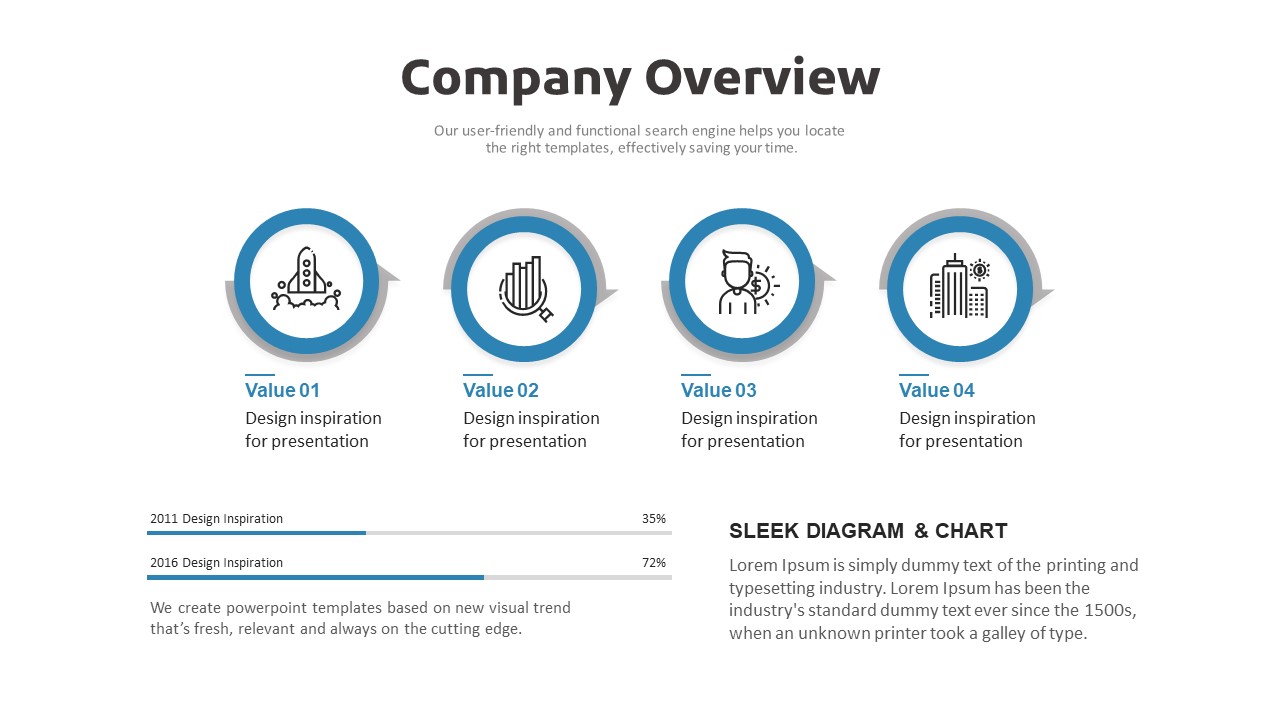
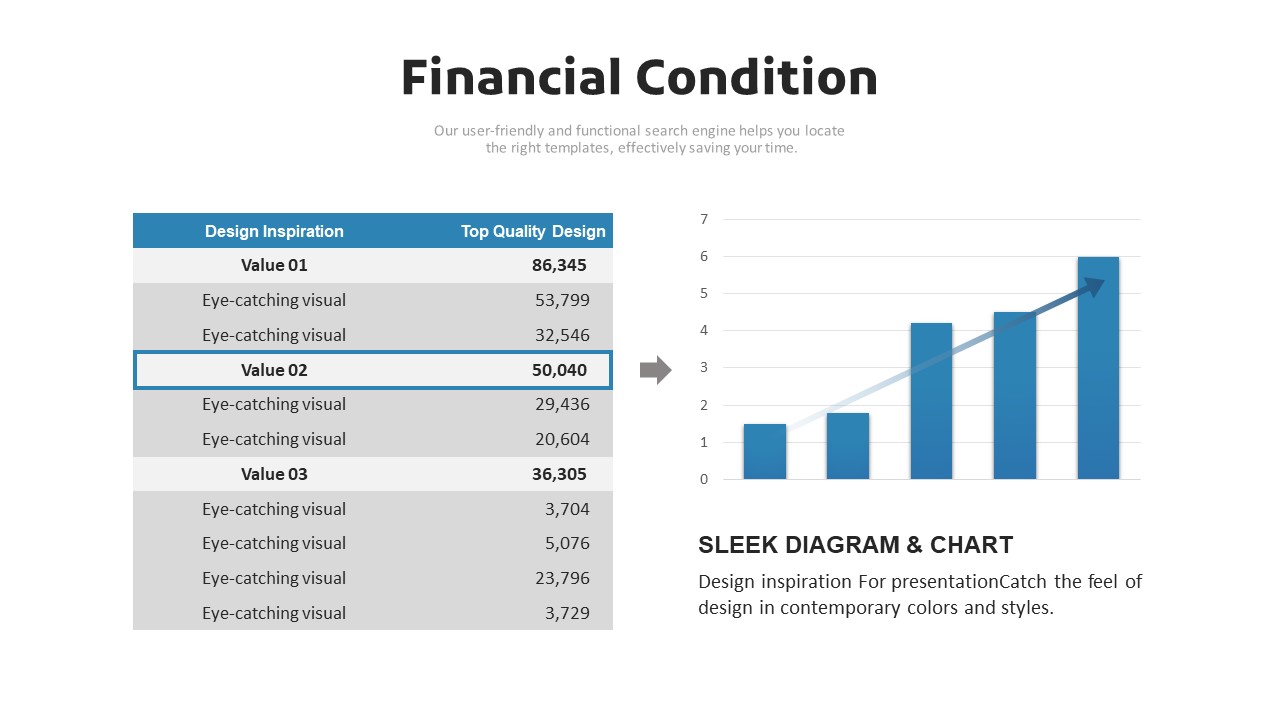
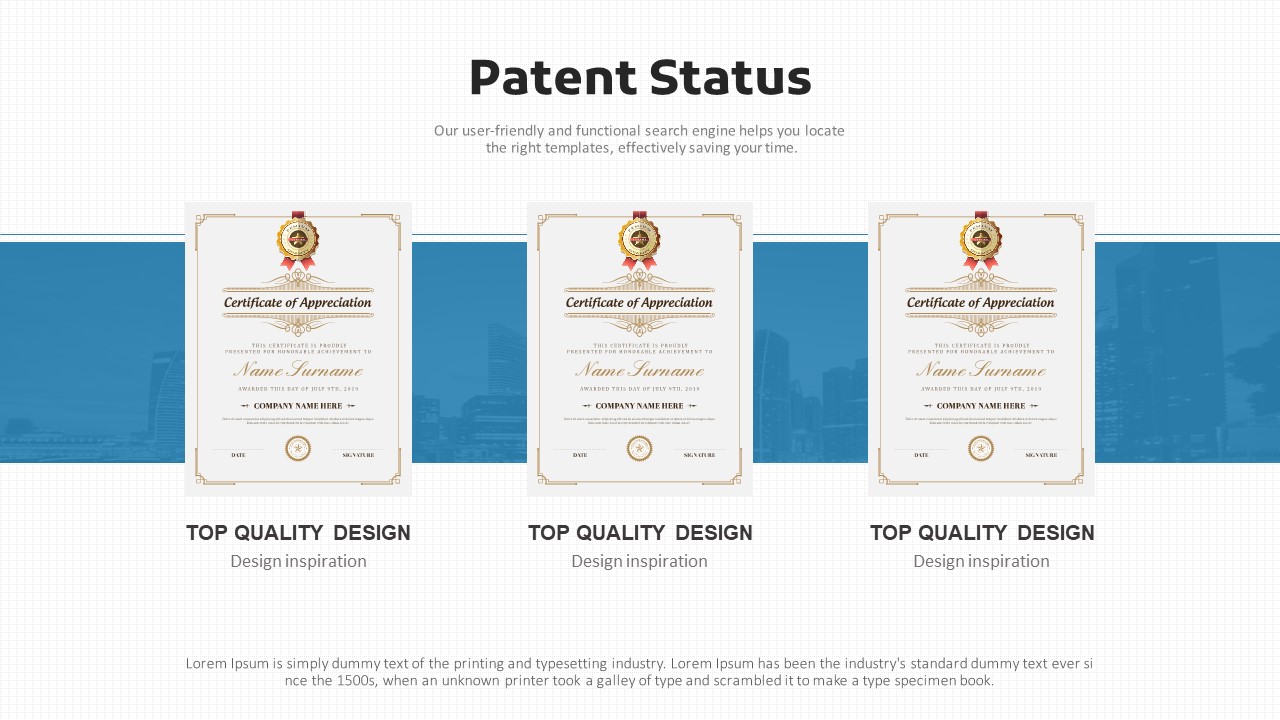
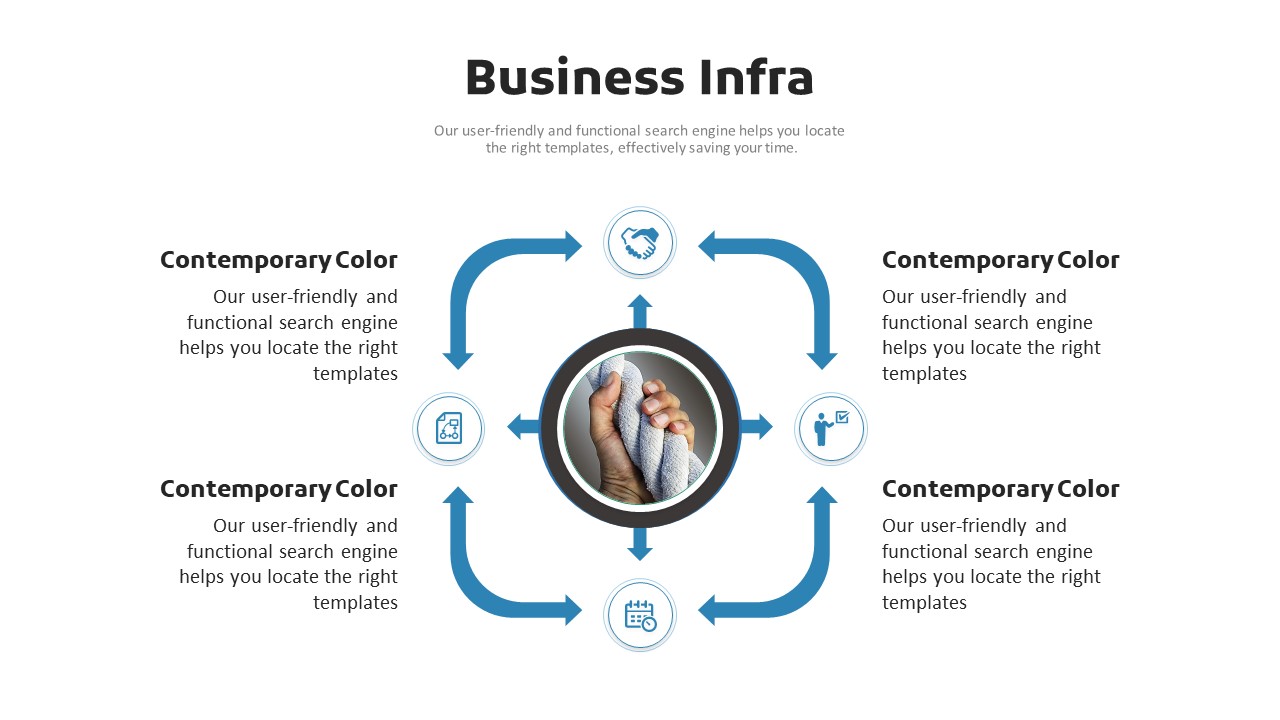
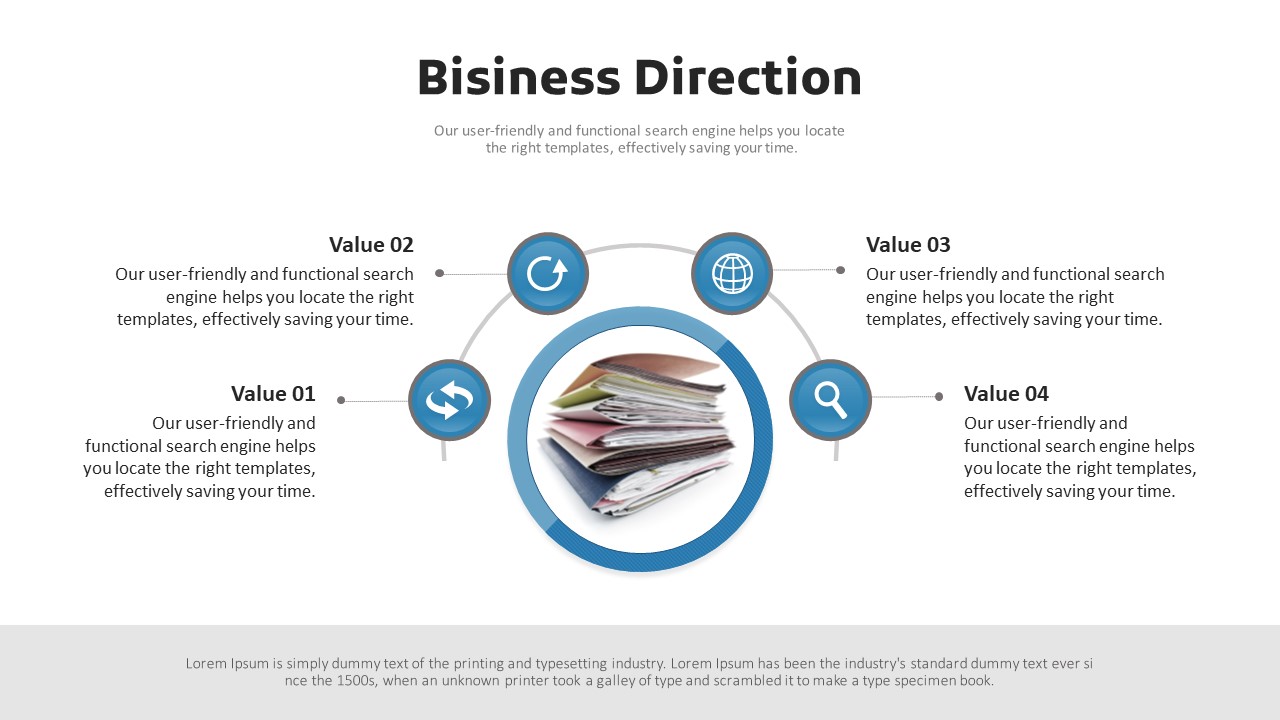
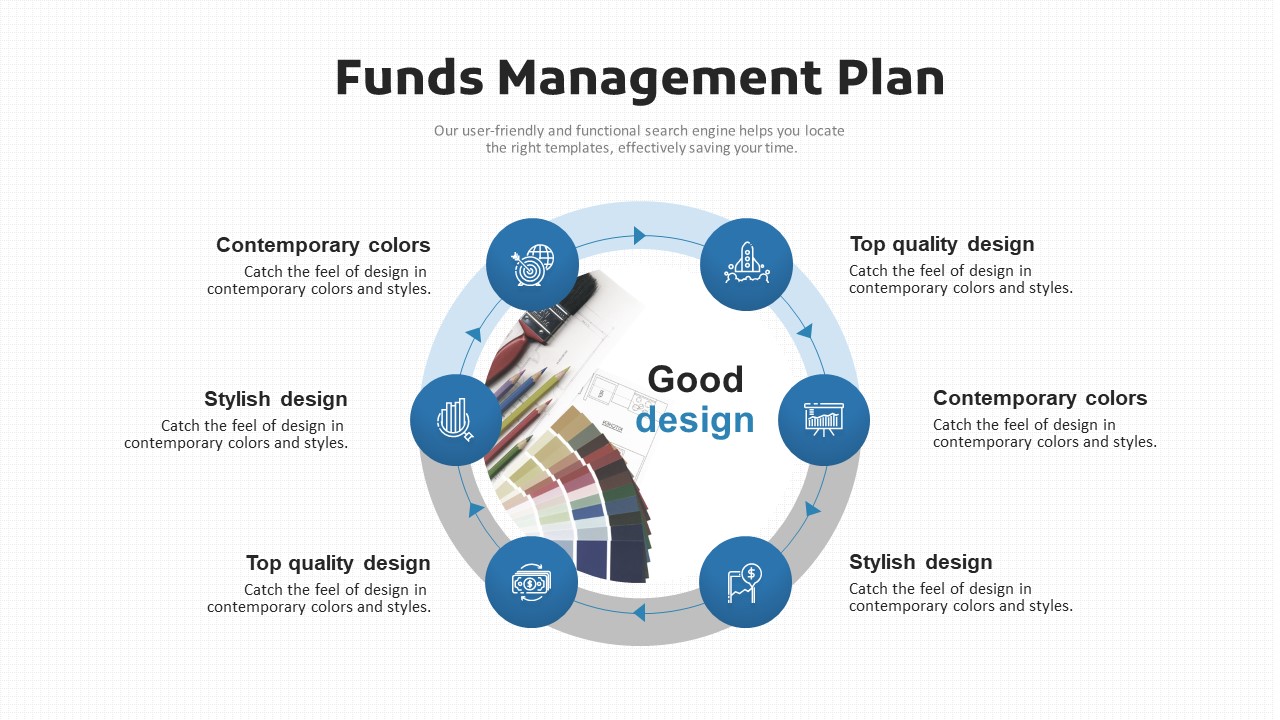
30 slides total: Cover (blue-dark split layout) → Table of Contents (4 sections) → Company Overview (4 icons + horizontal bar chart) → Business Infra (circular process diagram with 4-direction icons) → SWOT Analysis (4-quadrant) → Market Prospect (line graph 2021–2030 + data table + 30/50/20% infographic) → Business Plans → Financial Plans.
Related Products
-

Modern IR Vertical Template - Elegant Design and Effective Structure
#Investor Relations/IR
-

Investor Presentation Template | 30-Slide Full IR Deck That Clears Internal Investment Committee Review
#Investor Relations/IR
-

Modern IR PPT Template – Professional and Sleek Design
#Investor Relations/IR
-

New Drug Development Template Strategy Vertical – Modern Design and Intuitive Flow
#Investor Relations/IR
