SWOT Analysis Leaf Diagram – Essential Template for Market Analysis
RM0500001_17
- Last Update 02/19/2025
- File Size 1.7MB
- # of Slides 2
- File Format PPTX
- Slide Ratio 16:9
- Color
Keywords
- #Content-Based Slides
- #Design-Based Slides
- #Market and Competitor Analysis
- #Diagram
- #SWOT Analysis
- #Market Analysis
- #Spread
- #Decentralized Diagram
- #16:9
- #SWOT analysis diagram PowerPoint
- #SWOT analysis slide template
- #four-quadrant diagram
- #market analysis presentation
- #competitive analysis template
- #SWOT analysis slide download
About the Product
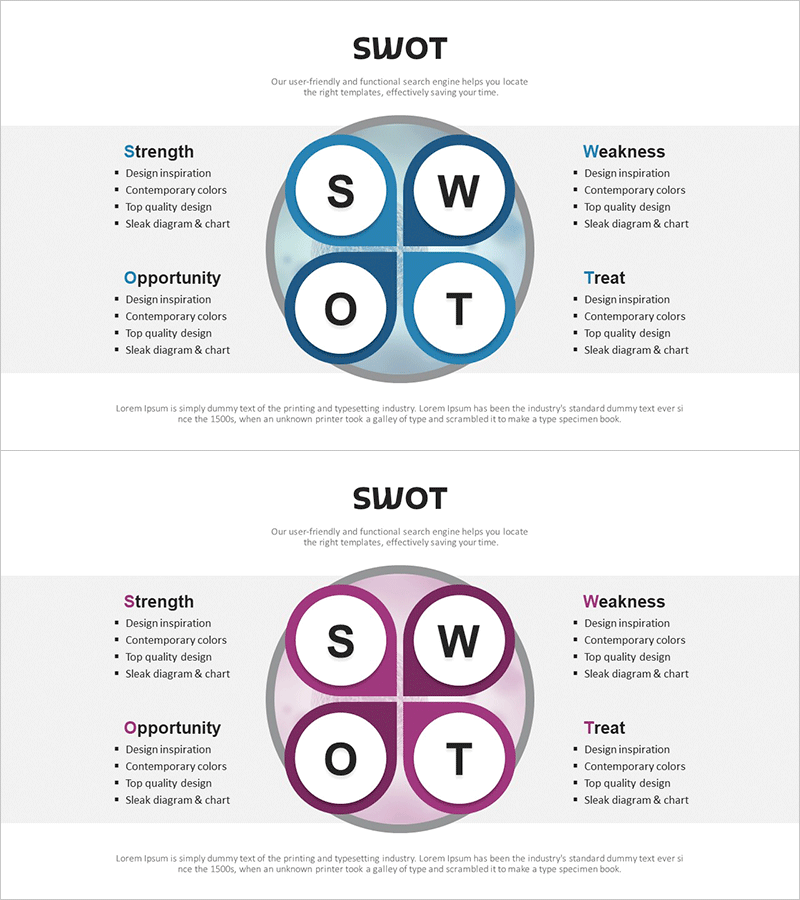
An essential PowerPoint slide for market analysis and competitive analysis featuring a SWOT diagram with four distinct quadrants: Strength, Weakness, Opportunity, and Threat. The circular node design clearly separates each analysis area, with two color versions available in blue and purple tones. Ample text input space in each quadrant makes this presentation template ideal for strategy meetings, business planning presentations, and marketing planning sessions. Delivered as 2 slides in 16:9 widescreen format with full editing capability.
Usage Points
-
Main Usage
Systematically analyze and visualize a company's strengths, weaknesses, market opportunities, and threats as a strategic planning tool. The four-quadrant structure enables clear communication of SWOT findings with executives and team members, supporting data-driven decision-making for business direction and strategy development.
-
How to Use
Enter analysis items within each circular node (S, W, O, T) and add detailed content in the left text area. Use the blue tone version for corporate presentations emphasizing trust and stability, or the purple tone for startup and marketing presentations highlighting creativity and innovation. Colors and text are fully customizable for any industry or presentation context.
-
Recommended For
Executive and strategy team business planning meetings, marketing team market and competitive analysis presentations, consultant strategic assessment reports, startup investor pitch decks (Series A/B funding), and business strategy lectures in educational institutions.
-
Slide Structure
2-slide set with 16:9 aspect ratio. Each slide features four circular nodes (S, W, O, T) positioned at the center with overlapping arrangement to visually represent interconnections. Text input areas with 4-item bullet lists are positioned in the upper left and right sections for each quadrant's detailed analysis points.
Related Products
-

SWOT Analysis Piece Diagram – Essential Tool for Market Analysis
#Market and Competitor Analysis #Diagram #SWOT Analysis
-

SWOT Circular Segmentation Diagram
#Market and Competitor Analysis #Diagram #SWOT Analysis
-

SWOT Analysis Circular Slice Diagram – Market and Competitor Analysis
#Market and Competitor Analysis #Diagram #SWOT Analysis
-

SWOT Analysis Diffusion Diagram – Effective Market Analysis Tool
#Market and Competitor Analysis #Diagram #SWOT Analysis
