Analysis Graph of Key Performance and Corporate Growth Indicators – Emphasizing Business Achievements
RM0500001_15
- Last Update 02/19/2025
- File Size 5.6MB
- # of Slides 2
- File Format PPTX
- Slide Ratio 16:9
- Color
Keywords
- #Content-Based Slides
- #Design-Based Slides
- #Business Strategy
- #Market and Competitor Analysis
- #Graph
- #Other
- #Achievements
- #Market Analysis
- #16:9
- #performance analysis graph PowerPoint
- #corporate growth indicators slide
- #year-over-year bar chart
- #business metrics presentation
- #how to create performance dashboard in PowerPoint
About the Product
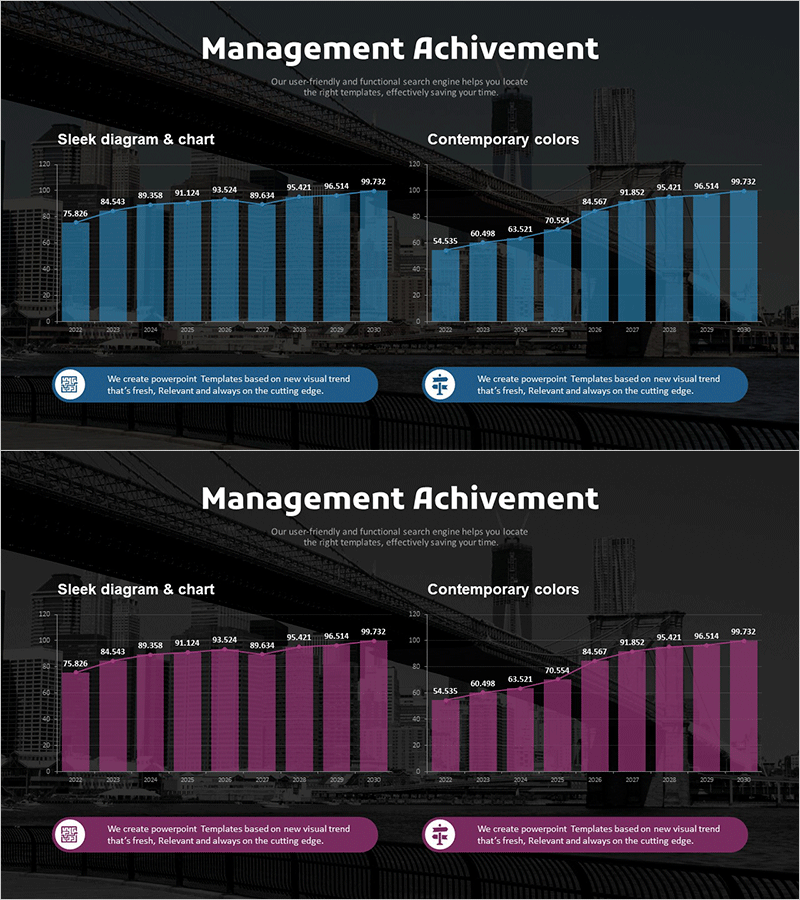
A 2-slide analysis graph PowerPoint presentation template that visualizes corporate growth indicators and key performance metrics. Featuring a dark background with dual-tone blue and magenta bar charts, this slide set emphasizes year-over-year performance comparison with two layout options: 'Sleek Diagram & Chart' on the left and 'Contemporary Colors' on the right. Each slide includes a title section, descriptive text area, and dual chart layouts optimized for data readability. Perfect for investor presentations, executive briefings, and business performance reports. Formatted in 16:9 widescreen PPTX for seamless integration into modern presentation environments.
Usage Points
-
Main Usage
Designed to clearly communicate quantitative data such as year-over-year performance trends, departmental achievement comparisons, and investor-focused growth metrics. The dark background with contrasting blue and magenta charts creates a professional, high-impact visual that builds credibility for executive presentations and external stakeholder communications.
-
How to Use
Enter your analysis topic in the title section at the top of each slide (e.g., 'Q1-Q4 2024 Revenue Performance'). Add key insights in the central text area. Replace chart values and legend labels with your actual data. Select either the blue or magenta layout version to match your corporate brand colors, then customize the data fields.
-
Recommended For
CFOs, financial analysts, business development managers, executive report coordinators, investor relations (IR) specialists, and marketing analytics professionals who need to present quarterly or annual performance comparisons and growth metrics.
-
Slide Structure
Each slide contains a title section (1 text box), descriptive text area (1 text box), left-side bar chart with legend, and right-side bar chart with legend. Both slides follow identical structural layouts with color themes differentiated between blue and magenta versions, enabling side-by-side comparative analysis presentations.
Related Products
-

Management Performance Comparison Analysis Chart – Data-Driven Decision Making
#Business Strategy #Market and Competitor Analysis #Graph
-

Eco-friendly Survey Graph – Environmental Protection and Data Utilization
#Business Strategy #Market and Competitor Analysis #Graph
-

Graph of Major Projects and Success Stories - Business Achievement
#Business Strategy #Market and Competitor Analysis #Graph
-

Selected Area Graphs – Market and Performance Analysis
#Business Strategy #Market and Competitor Analysis #Graph
