History Wave Diagram - Visualizing Company Development
RM0500001_6
- Last Update 02/20/2025
- File Size 1.1MB
- # of Slides 2
- File Format PPTX
- Slide Ratio 16:9
- Color
Keywords
About the Product
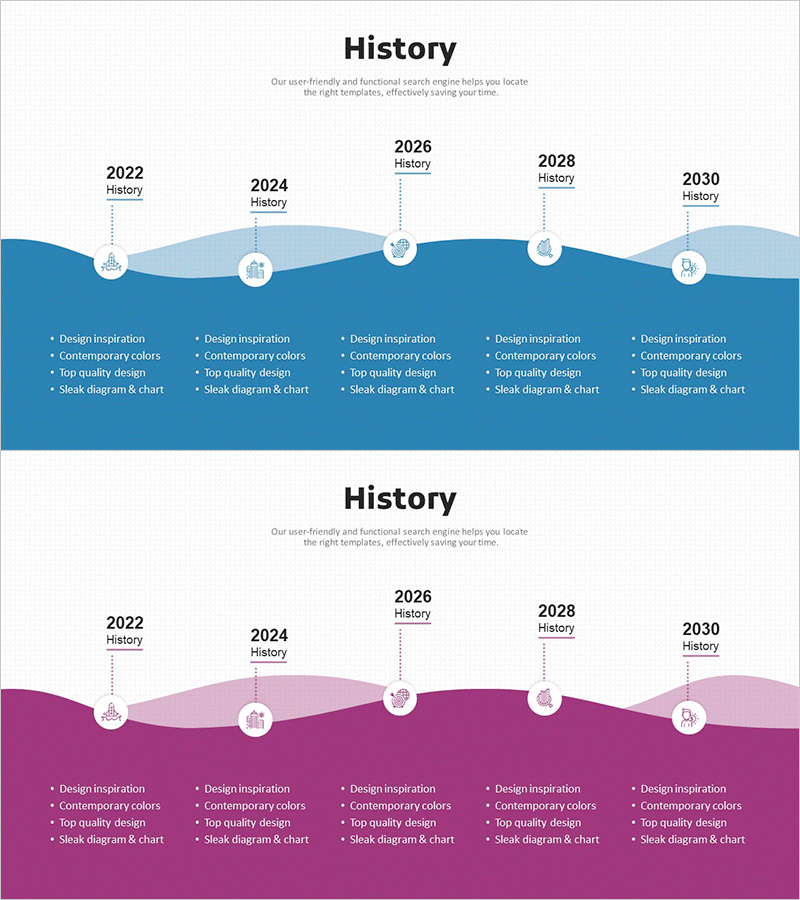
A wave-form timeline diagram PowerPoint slide that visualizes your company's development journey across five key milestones from 2022 to 2030. This presentation template features two color variations—blue and pink gradient backgrounds—with circular node markers and bullet-point areas for each year's achievements. The soft, flowing wave design creates a dynamic visual narrative ideal for company overview presentations, annual reports, and business development pitches. Delivered in 16:9 widescreen PPTX format, fully editable for text, colors, and layout customization.
Usage Points
-
Main Usage
Effectively communicate your organization's growth trajectory and key milestones by presenting company history in a visually engaging timeline format. This diagram transforms chronological data into an intuitive narrative that builds credibility and demonstrates organizational maturity to investors, partners, and employees.
-
How to Use
Enter your company's major achievements, product launches, or expansion milestones in the bullet-point sections beneath each year node. Customize colors to represent different business divisions or achievement categories. Easily add or remove timeline nodes to adjust the time span and adapt the template to your specific company history.
-
Recommended For
Company overview presentations, investor pitch decks, annual business reports, executive summaries, corporate training materials, and organizational history documentation. Particularly effective when presenting long-term growth narratives and demonstrating sustained business development.
-
Slide Structure
Two-slide template featuring blue and pink wave-form backgrounds. Five circular timeline nodes positioned at 2-year intervals from 2022 to 2030, with 3–4 bullet-point entry areas beneath each node for milestone descriptions and achievements.
Related Products
-

Silhouette History Diagram – Visualizing Evolution
#Company Introduction #Diagram #Other
-

Company History Mini Diagram – Clear and Concise Timeline
#Company Introduction #Diagram #History
-

History Flag Shape Diagram - Company Growth and Vision
#Company Introduction #Diagram #History
-

Business History Connection Diagram
#Company Introduction #Diagram #History
