Competitor Analysis and Differentiation Strategy Diagram
RM0500001_13
- Last Update 02/19/2025
- File Size 1.5MB
- # of Slides 2
- File Format PPTX
- Slide Ratio 16:9
- Color
Keywords
- #Content-Based Slides
- #Design-Based Slides
- #Market and Competitor Analysis
- #Diagram
- #Graph
- #Competitor Analysis
- #Competitive Advantage
- #Spread
- #Horizontal Bar
- #Centralized Diagram
- #Horizontal Bar Chart
- #16:9
- #radial diagram PowerPoint
- #competitor analysis slide
- #5-node diagram
- #how to create competitor analysis in PowerPoint
- #competitive strategy slide template
About the Product
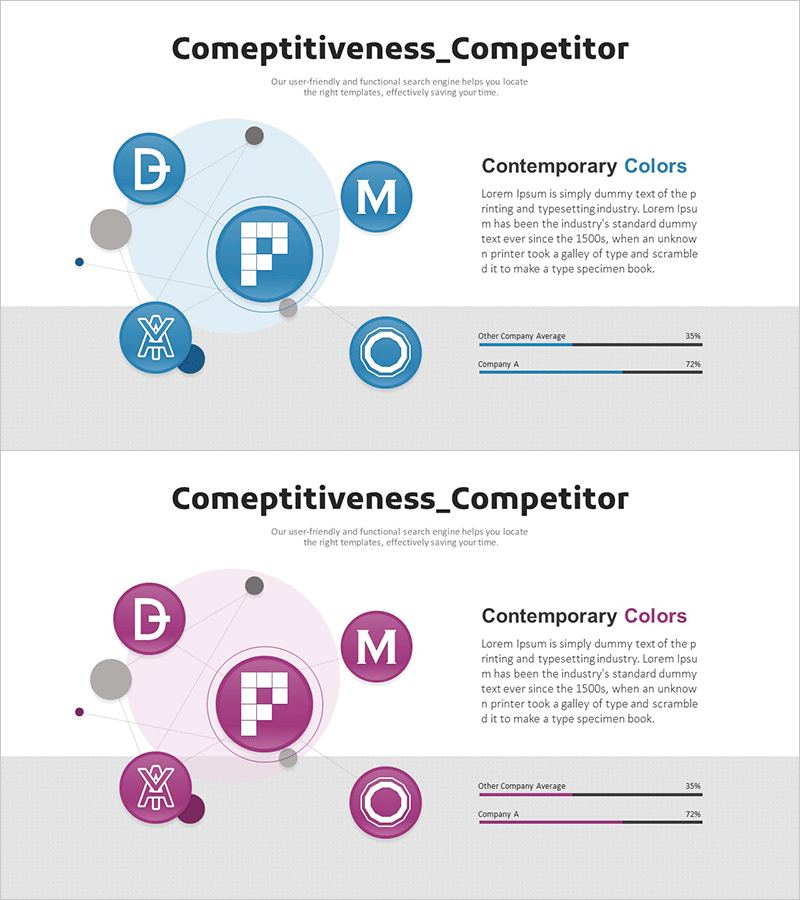
A radial diagram PowerPoint slide for visualizing competitor analysis and differentiation strategy. The design features a central hub node (F) with five surrounding nodes (D, M, and three icon nodes) radiating outward, enabling side-by-side comparison of competitor characteristics. The right side includes a horizontal bar chart for quantitative metrics. Two slide variations are provided in blue and purple color schemes, in 16:9 widescreen PPTX format with full editing capability.
Usage Points
-
Main Usage
Visualize competitor analysis and differentiation strategy using a radial hub-and-spoke structure that clearly positions your company against multiple competitors. The five surrounding nodes allow simultaneous comparison of competitive players, while the horizontal bar chart on the right displays quantitative performance indicators such as market share or competitive strength scores.
-
How to Use
Use in the market analysis section of business strategy or marketing plan presentations. Enter your company name in the central node and competitor names in the five surrounding nodes. Customize the icons and colors in each node to represent competitor attributes (technology, pricing, customer satisfaction). Update the right-side bar chart with market share or competitive index data to provide quantitative evidence.
-
Recommended For
Ideal for strategy planning teams, marketing departments, and sales teams presenting competitive analysis. Recommended for investor pitch decks explaining market positioning, and new business planning presentations analyzing competitive landscape. Most effective when comparing five or more competitors simultaneously.
-
Slide Structure
Slide 1: Blue-tone radial diagram with large central circular node (F), five surrounding circular nodes (D, M, three icon nodes), connecting lines, and two-series horizontal bar chart on the right. Slide 2: Identical structure in purple tone. All text, nodes, and chart elements are fully editable with customizable colors.
Related Products
-

Agricultural Competitor Analysis Horizontal Bar Chart
#Market and Competitor Analysis #Graph #Competitor Analysis
-

Green & Gray Horizontal Bar Chart – Market Analysis and Competitive Edge
#Market and Competitor Analysis #Graph #Competitor Analysis
-

Triangle Pattern Wide PowerPoint Template – Horizontal Bar Chart
#Market and Competitor Analysis #Graph #Competitor Analysis
-

Horizontal Bar Chart for Competitive Advantage Analysis – Sea Lighthouse
#Market and Competitor Analysis #Diagram #Graph
