Expected Funding Needs Analysis Table – Financial Planning and Performance
RM0500001_27
- Last Update 02/20/2025
- File Size 1.4MB
- # of Slides 2
- File Format PPTX
- Slide Ratio 16:9
- Color
Keywords
- #Content-Based Slides
- #Design-Based Slides
- #Financial Plans and Performance
- #Diagram
- #Projected Return on Investment (ROI)
- #Budget
- #Table
- #16:9
- #estimated funds analysis table PowerPoint
- #financial data table slide design
- #budget planning PPT slide
- #how to create a financial table in PowerPoint
- #funding needs comparison slide
About the Product
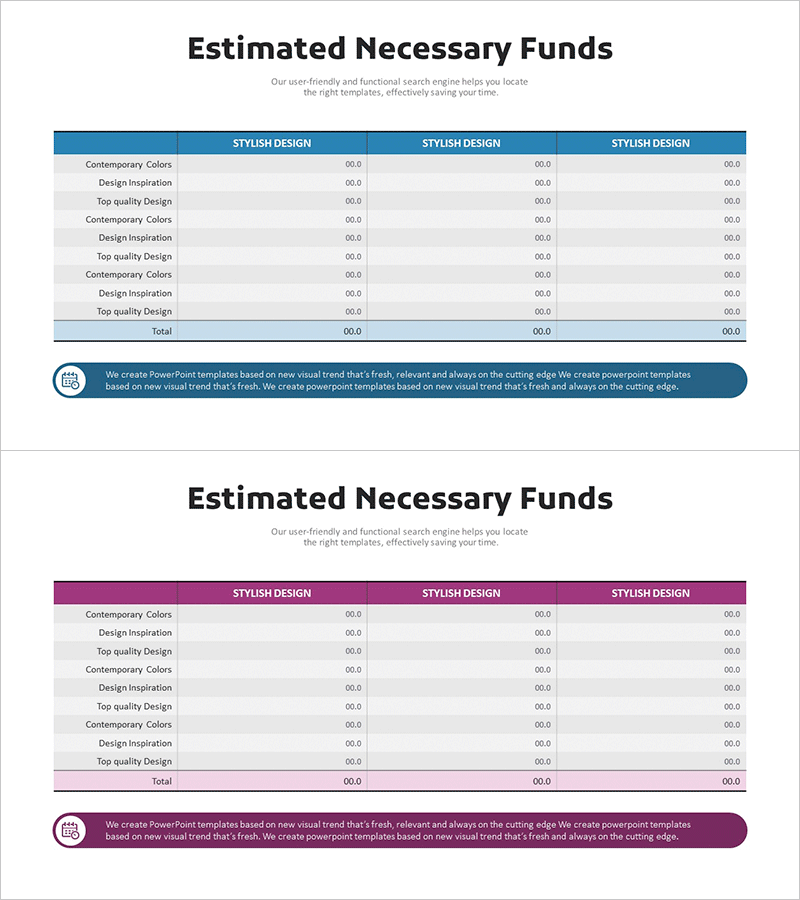
A financial data table PowerPoint slide designed to compare estimated funding needs with actual performance side by side. The 3-column layout organizes fund categories, planned amounts, and actual amounts for clear presentation. This presentation slide effectively communicates financial status and budget allocation in investor meetings, business reports, and financial reviews. The blue header and gray row dividers enhance readability, while ample data entry cells enable immediate customization. Optimized for IR materials, quarterly business reports, and investment pitch decks.
Usage Points
-
Main Usage
This slide visualizes corporate funding requirements and financial performance through numerical data. The side-by-side layout of planned and actual amounts clearly highlights variances and financial health. It builds investor confidence by presenting transparent, data-driven financial information to stakeholders, employees, and partners.
-
How to Use
Enter fund category names (salaries, equipment, operations, etc.) and corresponding amounts into the table cells. Input planned and actual figures in their respective columns for immediate comparative analysis. The blue header can be customized to match corporate branding, and row heights and column widths are adjustable based on data volume.
-
Recommended For
CFOs, finance managers, and executives preparing IR presentations, quarterly business reports, investor meetings, and shareholder meetings. Ideal for startup fundraising pitches, corporate financial disclosures, and consulting reports requiring transparent budget visualization.
-
Slide Structure
Two-slide set with the first featuring a blue header (3 columns: category, planned amount, actual amount) and 10 data entry rows; the second slide uses a magenta header variant. Both slides are optimized for 16:9 widescreen format with a simple, non-merged cell structure for easy editing and data input.
Related Products
-

Expected Investment Return Calculation Slide
#Financial Plans and Performance #Diagram #Projected Return on Investment (ROI)
-

Marketing Budget Analysis Table – Optimized for Financial Performance
#Financial Plans and Performance #Diagram #Projected Return on Investment (ROI)
-

Estimated Fund Requirements for Real Estate Investment Slide – Foundation of Financial Planning
#Financial Plans and Performance #Diagram #Projected Return on Investment (ROI)
-

Expected Return on Investment Chart – Visualizing Financial Performance
#Financial Plans and Performance #Diagram #Projected Return on Investment (ROI)
