Financial Status and Stability Analysis Graph
RM0500001_7
- Last Update 02/20/2025
- File Size 1MB
- # of Slides 2
- File Format PPTX
- Slide Ratio 16:9
- Color
Keywords
- #Content-Based Slides
- #Design-Based Slides
- #Business Introduction
- #Diagram
- #Graph
- #Business Understanding
- #Table
- #Horizontal Bar
- #Standard Table
- #Horizontal Bar Chart
- #16:9
- #financial analysis chart PowerPoint
- #bar chart slide template
- #financial status presentation
- #business metrics graph
- #data comparison slide download
About the Product
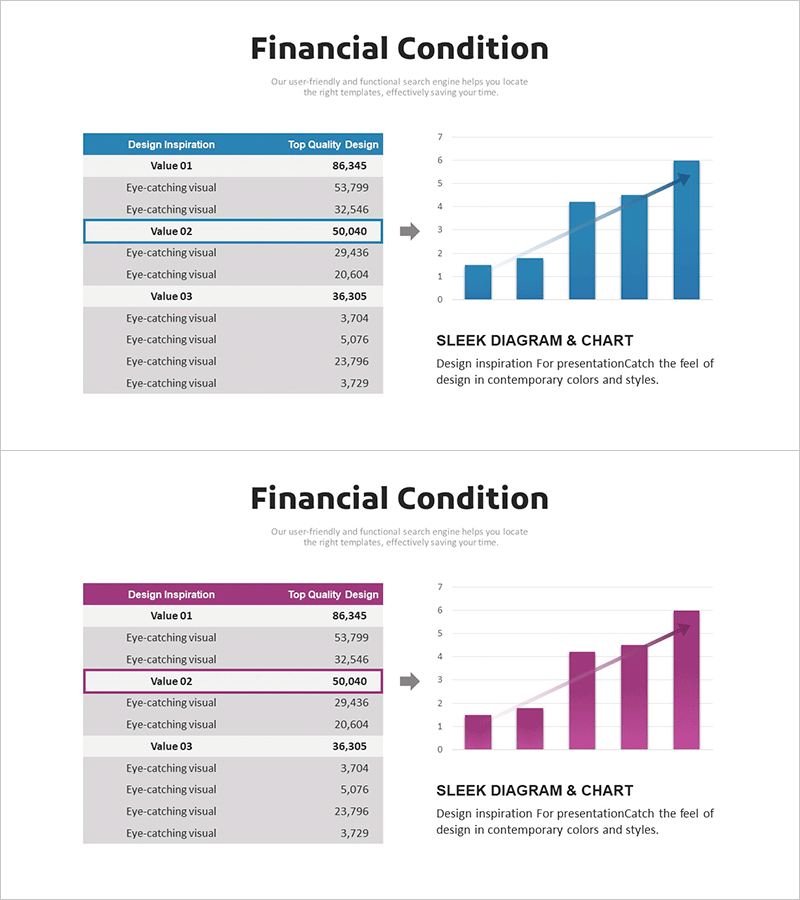
A 2-slide PowerPoint presentation that visualizes financial status and stability analysis with dual data representation. Each slide combines a structured financial metrics table (Value 01, 02, 03 with sub-indicators) with vertical bar charts showing 5 data points for trend comparison. Two color schemes are provided—blue and purple versions—with matching header colors and chart series for consistent brand identity. Delivered in 16:9 widescreen PPTX format, fully editable and ready to use in financial reports, business pitches, investor presentations, and quarterly earnings reviews.
Usage Points
-
Main Usage
Clearly compare financial indicators and quantitative data while communicating trend changes over time through visual representation. The dual structure of table and chart allows simultaneous presentation of raw metrics and analytical insights to stakeholders.
-
How to Use
Insert into financial reports' current status section, business pitch presentations' financial overview slide, or investor relations meetings' performance analysis page. Simply replace table values with your data and update chart series—the graph auto-updates instantly.
-
Recommended For
CFOs, finance managers, executives, and investor relations professionals presenting financial performance. Ideal for consulting firms, financial institutions, startups pitching to investors, and quarterly or annual earnings reports.
-
Slide Structure
Slide 1: Blue header + 3 Value sections with 2–4 sub-indicators each + right-aligned vertical bar chart (5 data points). Slide 2: Purple header + identical table structure + vertical bar chart. Both slides maintain synchronized table-to-chart data flow for consistency.
Related Products
-

Competitor and Customer Analysis Horizontal Bar Graph and Table
#Market and Competitor Analysis #Diagram #Graph
-

Service Market Trends and Analysis Slide (Red and Blue)
#Market and Competitor Analysis #Diagram #Graph
-

Key Financial Indicators and Growth Outlook – Optimized Graphs for Investment Proposals
#Business Introduction #Market and Competitor Analysis #Diagram
-

Bar Graphs & Tables – New Dimension of Data Visualization
#Market and Competitor Analysis #Diagram #Graph
