Estimated Balance Sheet Table – A Benchmark for Financial Planning
RM0500001_26
- Last Update 02/19/2025
- File Size 1.5MB
- # of Slides 2
- File Format PPTX
- Slide Ratio 16:9
- Color
Keywords
About the Product
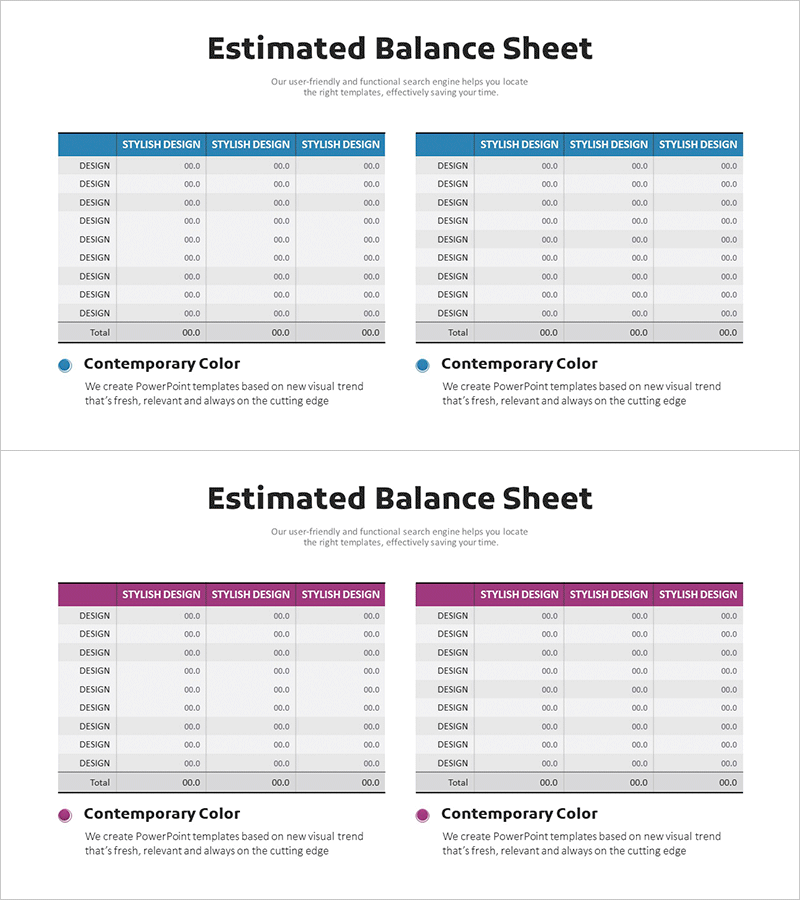
An essential PowerPoint slide for financial planning and investor presentations featuring a professional balance sheet layout. The design uses a blue header with a white background and a two-column table structure that clearly separates assets, liabilities, and equity sections. The 9-row framework includes subtotals and grand total rows, enabling systematic organization of financial data. This 16:9 widescreen 2-slide set is ideal for comparative analysis and year-over-year trend visualization, delivered in fully editable PPTX format for immediate customization.
Usage Points
-
Main Usage
Visualizes a company's financial position by categorizing assets, liabilities, and equity in a structured table format. Communicates financial health and capital structure clearly to investors, financial institutions, and stakeholders, serving as a core component in financial plans, business proposals, and investor relations materials.
-
How to Use
Enter actual financial figures directly into the table cells. Use the two-column layout to compare two fiscal years, two business scenarios, or projected versus actual balance sheets side by side. The blue header can be customized to match corporate branding, and all text and numerical values are fully editable.
-
Recommended For
CFOs, finance managers, and executives preparing investor presentations, shareholder meetings, and bank loan applications. Suitable for startups developing business plans, mid-size companies preparing financial disclosures, and large enterprises creating quarterly financial reports across all organizational scales.
-
Slide Structure
Each slide contains one title area and a two-column table section. The table features 3 columns (item name, first period data, second period data) and 9 rows (assets, current assets, non-current assets, liabilities, current liabilities, non-current liabilities, equity, subtotal, total), providing 27 editable data entry cells.
Related Products
-

Organize Financial Plans with Abstract Pattern Template
#Financial Plans and Performance #Diagram #Balance Sheet
-

Triangle Pattern PPT Table Chart – Visualizing Financial Performance
#Financial Plans and Performance #Diagram #Balance Sheet
-

Simple Yellow Purple Table – Financial Performance Visualization
#Financial Plans and Performance #Diagram #Balance Sheet
-

Checklist Table Slide for Financial Planning
#Financial Plans and Performance #Diagram #Balance Sheet
