Product Development Process Diagram - Visualization of Operations
RM0500001_20
- Last Update 02/19/2025
- File Size 1.2MB
- # of Slides 2
- File Format PPTX
- Slide Ratio 16:9
- Color
Keywords
- #Content-Based Slides
- #Design-Based Slides
- #Product/Service Introduction
- #Operational Plan
- #Diagram
- #Development Plan
- #Production and Technology Development Strategy
- #Cluster
- #Closed Cluster Diagram
- #16:9
- #cluster diagram PowerPoint
- #product development process slide
- #5-step process diagram
- #operations planning PowerPoint
- #process flow slide template
About the Product
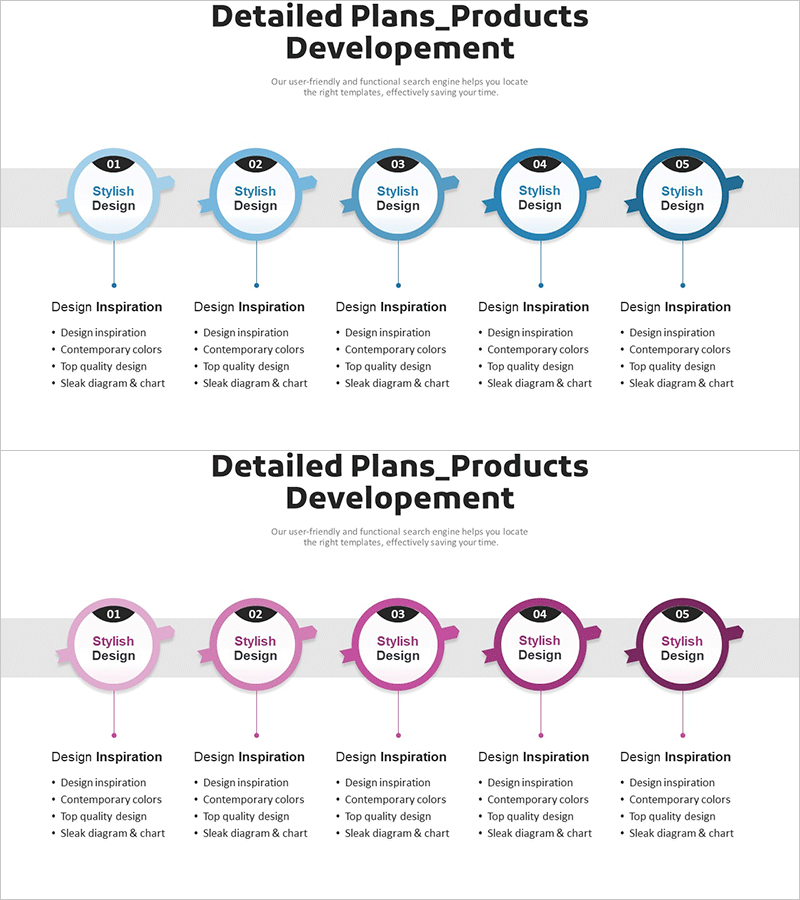
A PowerPoint slide visualizing the product development process through a 5-step cluster structure with circular nodes connected by directional arrows. Each stage is clearly defined with sequential flow, using light blue and dark blue tones to emphasize professionalism. Ideal for operations planning, strategy presentations, and project management discussions. The 2-slide set includes color variations in blue and purple, allowing customization to match your corporate brand identity and presentation style.
Usage Points
-
Main Usage
Systematically explain each stage of product development and visually communicate team responsibilities and project timelines. Effectively present project progress to executives, investors, and team members during meetings and pitches.
-
How to Use
Enter stage names (planning, design, development, testing, launch, etc.) in each circular node and add detailed descriptions in the text areas below. Modify colors to distinguish priorities or departments, and adjust arrow directions to fit various process flows and organizational structures.
-
Recommended For
Product managers, project managers, operations specialists, and executives presenting strategy meetings, business plans, and project kickoffs. Particularly valuable in IT, manufacturing, and service industries for process improvement and efficiency discussions.
-
Slide Structure
2-slide set with 5 circular nodes connected sequentially by directional arrows in a cluster layout. First slide features light blue tones, second slide offers purple variations. Each node includes text input areas below for stage descriptions and detailed explanations.
Related Products
-

Execution Plan for Wind Energy Integration – Technology Development and Production Strategy
#Product/Service Introduction #Operational Plan #Diagram
-

Visualizing Product Development Strategy with Gear Diagram
#Product/Service Introduction #Operational Plan #Diagram
-

Medicine Development Progress Plan Slide
#Product/Service Introduction #Operational Plan #Diagram
-

Slide for Product Development Plans – Cluster Design
#Product/Service Introduction #Operational Plan #Diagram
