Industry Trends and Market Growth Analysis Chart
RM0500001_10
- Last Update 02/19/2025
- File Size 1.5MB
- # of Slides 2
- File Format PPTX
- Slide Ratio 16:9
- Color
Keywords
- #Content-Based Slides
- #Design-Based Slides
- #Market and Competitor Analysis
- #Diagram
- #Graph
- #Other
- #Market Status
- #Future Outlook
- #Table
- #16:9
- #market analysis chart PowerPoint
- #market growth line graph slide
- #industry trends presentation
- #data table visualization
- #how to create market analysis in PowerPoint
About the Product
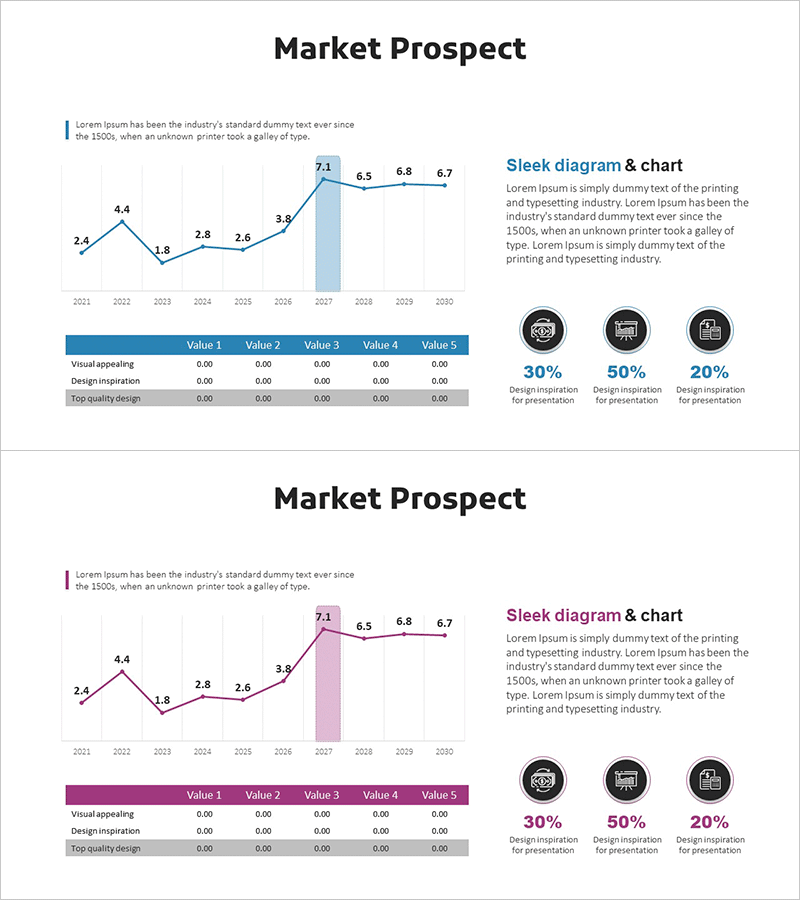
A 2-slide PowerPoint presentation visualizing industry trends and market growth projections. The slide combines a line graph showing year-over-year data from 2011 to 2030 with a structured data table below, comparing five key metrics across five value columns. The left side features a descriptive text block with visual icons, while the right side displays the chart and table. Two color versions—blue and pink—are included to match corporate branding. The layout separates information clearly for presentation readability. Ideal for market analysis, competitive positioning, and growth forecast sections in business proposals and investor presentations.
Usage Points
-
Main Usage
Communicates market conditions and future growth forecasts through combined visual and numerical data. The line graph trend and detailed table values work together to present market insights with high credibility to investors, partners, and stakeholders.
-
How to Use
Insert into business plans, investor pitch decks, and quarterly business reports in the market analysis section. Replace graph values with actual company data and customize the right-side description text to match your business context. Use the blue version for tech and finance presentations; pink version for marketing and consumer goods.
-
Recommended For
Executives, finance teams, marketing departments, and business development teams presenting market conditions. Particularly effective for new business proposals, market entry strategies, and investor meetings where market opportunity validation is critical.
-
Slide Structure
Slide 1: Title (Market Prospect) + left-side descriptive text block + center line graph (2011–2030 timeline, 7 data points) + right-side explanation area (Sleek diagram & chart heading + 3-line description + 3 icon indicators with percentages) + bottom data table (5 metrics × 5 value columns). Slide 2: Identical layout in pink color scheme.
Related Products
-

Industrial Data Report for Market Analysis Slides
#Market and Competitor Analysis #Diagram #Graph
-

Industry Growth Rate and Trend Analysis Chart – Market Prospect
#Market and Competitor Analysis #Graph #Other
-

Technology Outlook Graph - Market Status and Future Projections
#Market and Competitor Analysis #Graph #Other
-

Construction Company Debt and Capital Structure Analysis Chart
#Business Introduction #Market and Competitor Analysis #Diagram
