Successful Business Strategy Diagram – Connecting Business Objectives
RM0500001_19
- Last Update 02/19/2025
- File Size 1.9MB
- # of Slides 2
- File Format PPTX
- Slide Ratio 16:9
- Color
Keywords
- #Content-Based Slides
- #Design-Based Slides
- #Business Vision and Strategy
- #Diagram
- #Business Strategy
- #Business Goals
- #Cluster
- #Spread
- #Chain Diagram
- #Decentralized Diagram
- #16:9
- #radial diagram PowerPoint
- #business strategy slide template
- #4-node connection diagram
- #business objective visualization PPT
- #strategy relationship chart presentation
About the Product
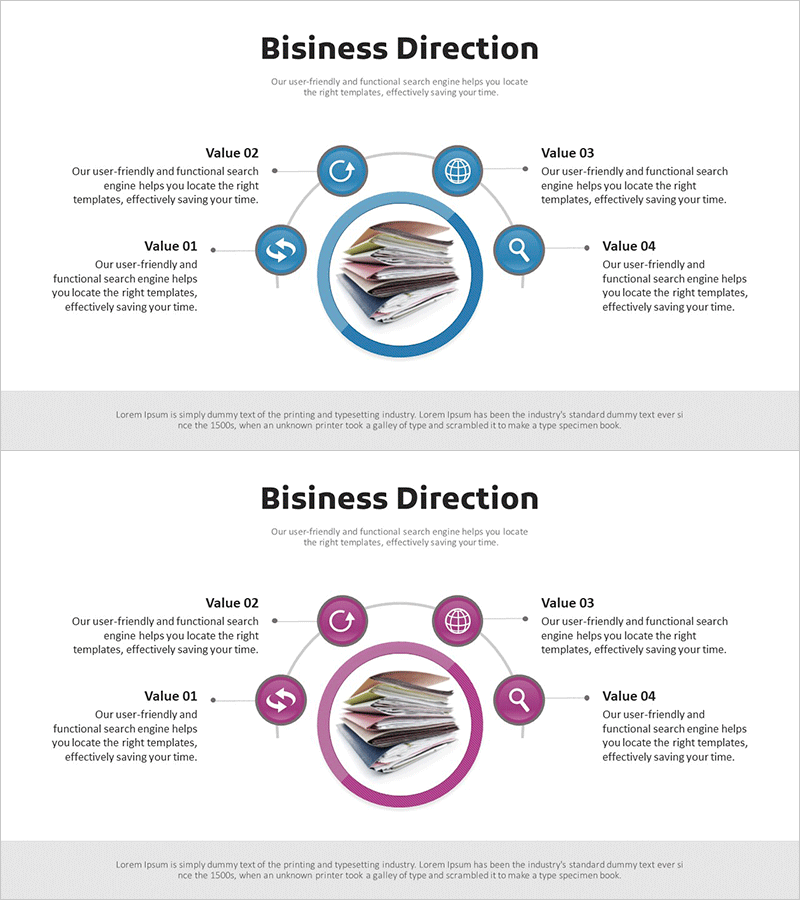
A PowerPoint slide featuring a radial diagram with four circular nodes surrounding a central image, designed to visualize business objectives and strategic connections. The blue-toned circular icons and connecting lines clearly express the relationships between core values, strategic directions, and business goals. Each node provides an independent text area for presenting diverse business messages such as strategic initiatives, goal-setting frameworks, and value propositions. This presentation slide effectively emphasizes strategic linkages in business proposals, executive reports, and strategic planning documents.
Usage Points
-
Main Usage
Visually represents the interconnected relationships between a company's core business objective and four strategic elements (values, direction, goals, execution). This diagram is used for strategic communication including business strategy development, management direction presentation, and organizational goal alignment.
-
How to Use
Place your core business concept (company name, core value, business objective) in the central image area, and input specific strategic items in the four nodes. Use this slide in executive reports, business plans, and strategic presentations to emphasize the connection between goals and execution strategies.
-
Recommended For
Recommended for executives, strategic planning teams, business development managers, and consultants explaining business strategy and goal relationships. Ideal for business plans, management reports, strategy seminars, and investment pitch presentations.
-
Slide Structure
Four circular nodes are symmetrically positioned around a central image or text box. Each node consists of a blue circular icon and text area, with connecting lines from the center to each node expressing relationships. The 2-slide set is adaptable to various business scenarios and strategic frameworks.
Related Products
-

Coffee Imprint Diagram – Visualizing Business Strategy
#Business Vision and Strategy #Diagram #Business Strategy
-

Three Routes Toward Innovation – Business Goals and Strategy Diagram
#Business Vision and Strategy #Diagram #Business Strategy
-

Business Connections Circular Diagram – Business Goals and Strategies
#Business Vision and Strategy #Diagram #Business Strategy
-

Key Focus Areas for Service Delivery – Effective Business Objectives Presentation
#Business Vision and Strategy #Diagram #Business Strategy
