Enhancing Financial Planning with Estimated Income Report Table Chart
RM0500001_25
- Last Update 02/19/2025
- File Size 1.5MB
- # of Slides 2
- File Format PPTX
- Slide Ratio 16:9
- Color
Keywords
- #Content-Based Slides
- #Design-Based Slides
- #Financial Plans and Performance
- #Diagram
- #Income Statement
- #Sales and Revenue
- #Table
- #16:9
- #estimated income report PowerPoint slide
- #financial table design
- #income analysis comparison slide
- #how to create income statement in PowerPoint
- #financial planning template
About the Product
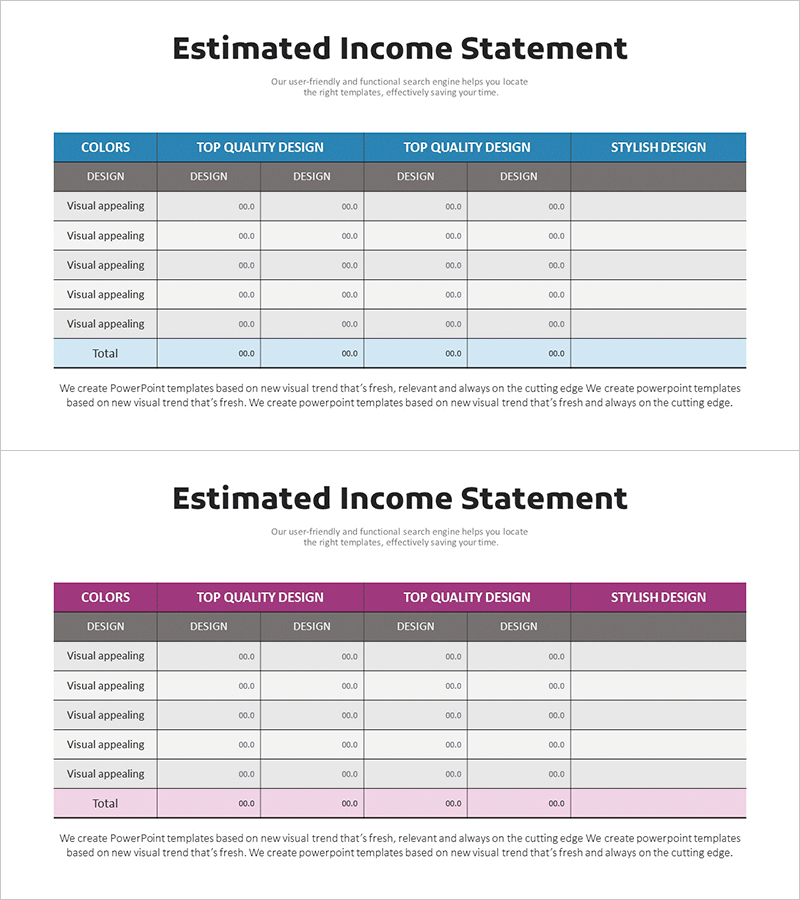
A financial planning PowerPoint slide featuring an estimated income report with a 4-column comparison table layout. The design uses a blue header row and gray data rows, offering three color scheme options: blue, pink, and gray. Each column represents different design categories (Top Quality Design, Stylish Design), while rows display evaluation metrics (Visual Appealing, Total). This slide effectively visualizes financial data and is ready to use in investor presentations or financial reporting sections of your PowerPoint deck.
Usage Points
-
Main Usage
Clearly visualize estimated income data during financial planning and support comparative analysis across multiple design options. Optimized for effectively communicating income projections in investor presentations and financial reports.
-
How to Use
Enter actual income data into the 4-column table and select a color scheme (blue, pink, or gray) that matches your document's tone. Customize row labels to align with your financial metrics, then insert into your IR materials or financial planning presentation.
-
Recommended For
CFOs, finance teams, and investor relations professionals creating financial plans, investor decks, and quarterly financial reports. Ideal for startup fundraising pitches and corporate financial analysis meetings where income projections need clear explanation.
-
Slide Structure
Structured as a 4-column comparison table with a color-coded header row and five data rows (Visual Appealing metrics, items 1-4, and Total). Each column represents an independent design option with clearly defined numeric input areas.
Related Products
-

Affiliate Business Income Statement – Visualizing Financial Performance
#Financial Plans and Performance #Diagram #Income Statement
-

Sales and Bills Slide for Navigation App
#Financial Plans and Performance #Diagram #Income Statement
-

Sales and Profit Table – Clear Visualization of Financial Planning
#Financial Plans and Performance #Diagram #Other
-

Income Statement Table – Clear Visualization of Financial Performance
#Financial Plans and Performance #Diagram #Income Statement
