Big Data PPT Template Wide – Modern and Stylish Design
J0400071
- Last Update 08/29/2025
- File Size 39.5MB
- # of Slides 31
- File Format PPTX
- Slide Ratio 16:9
- Color
Slide Preview


Keywords
About the Product
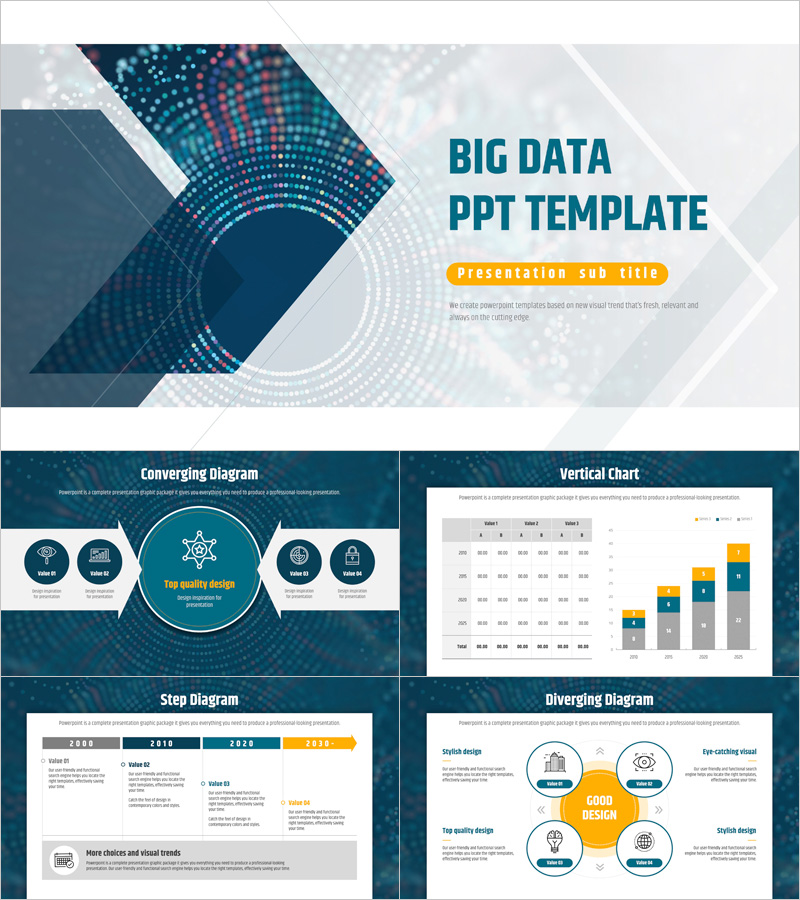
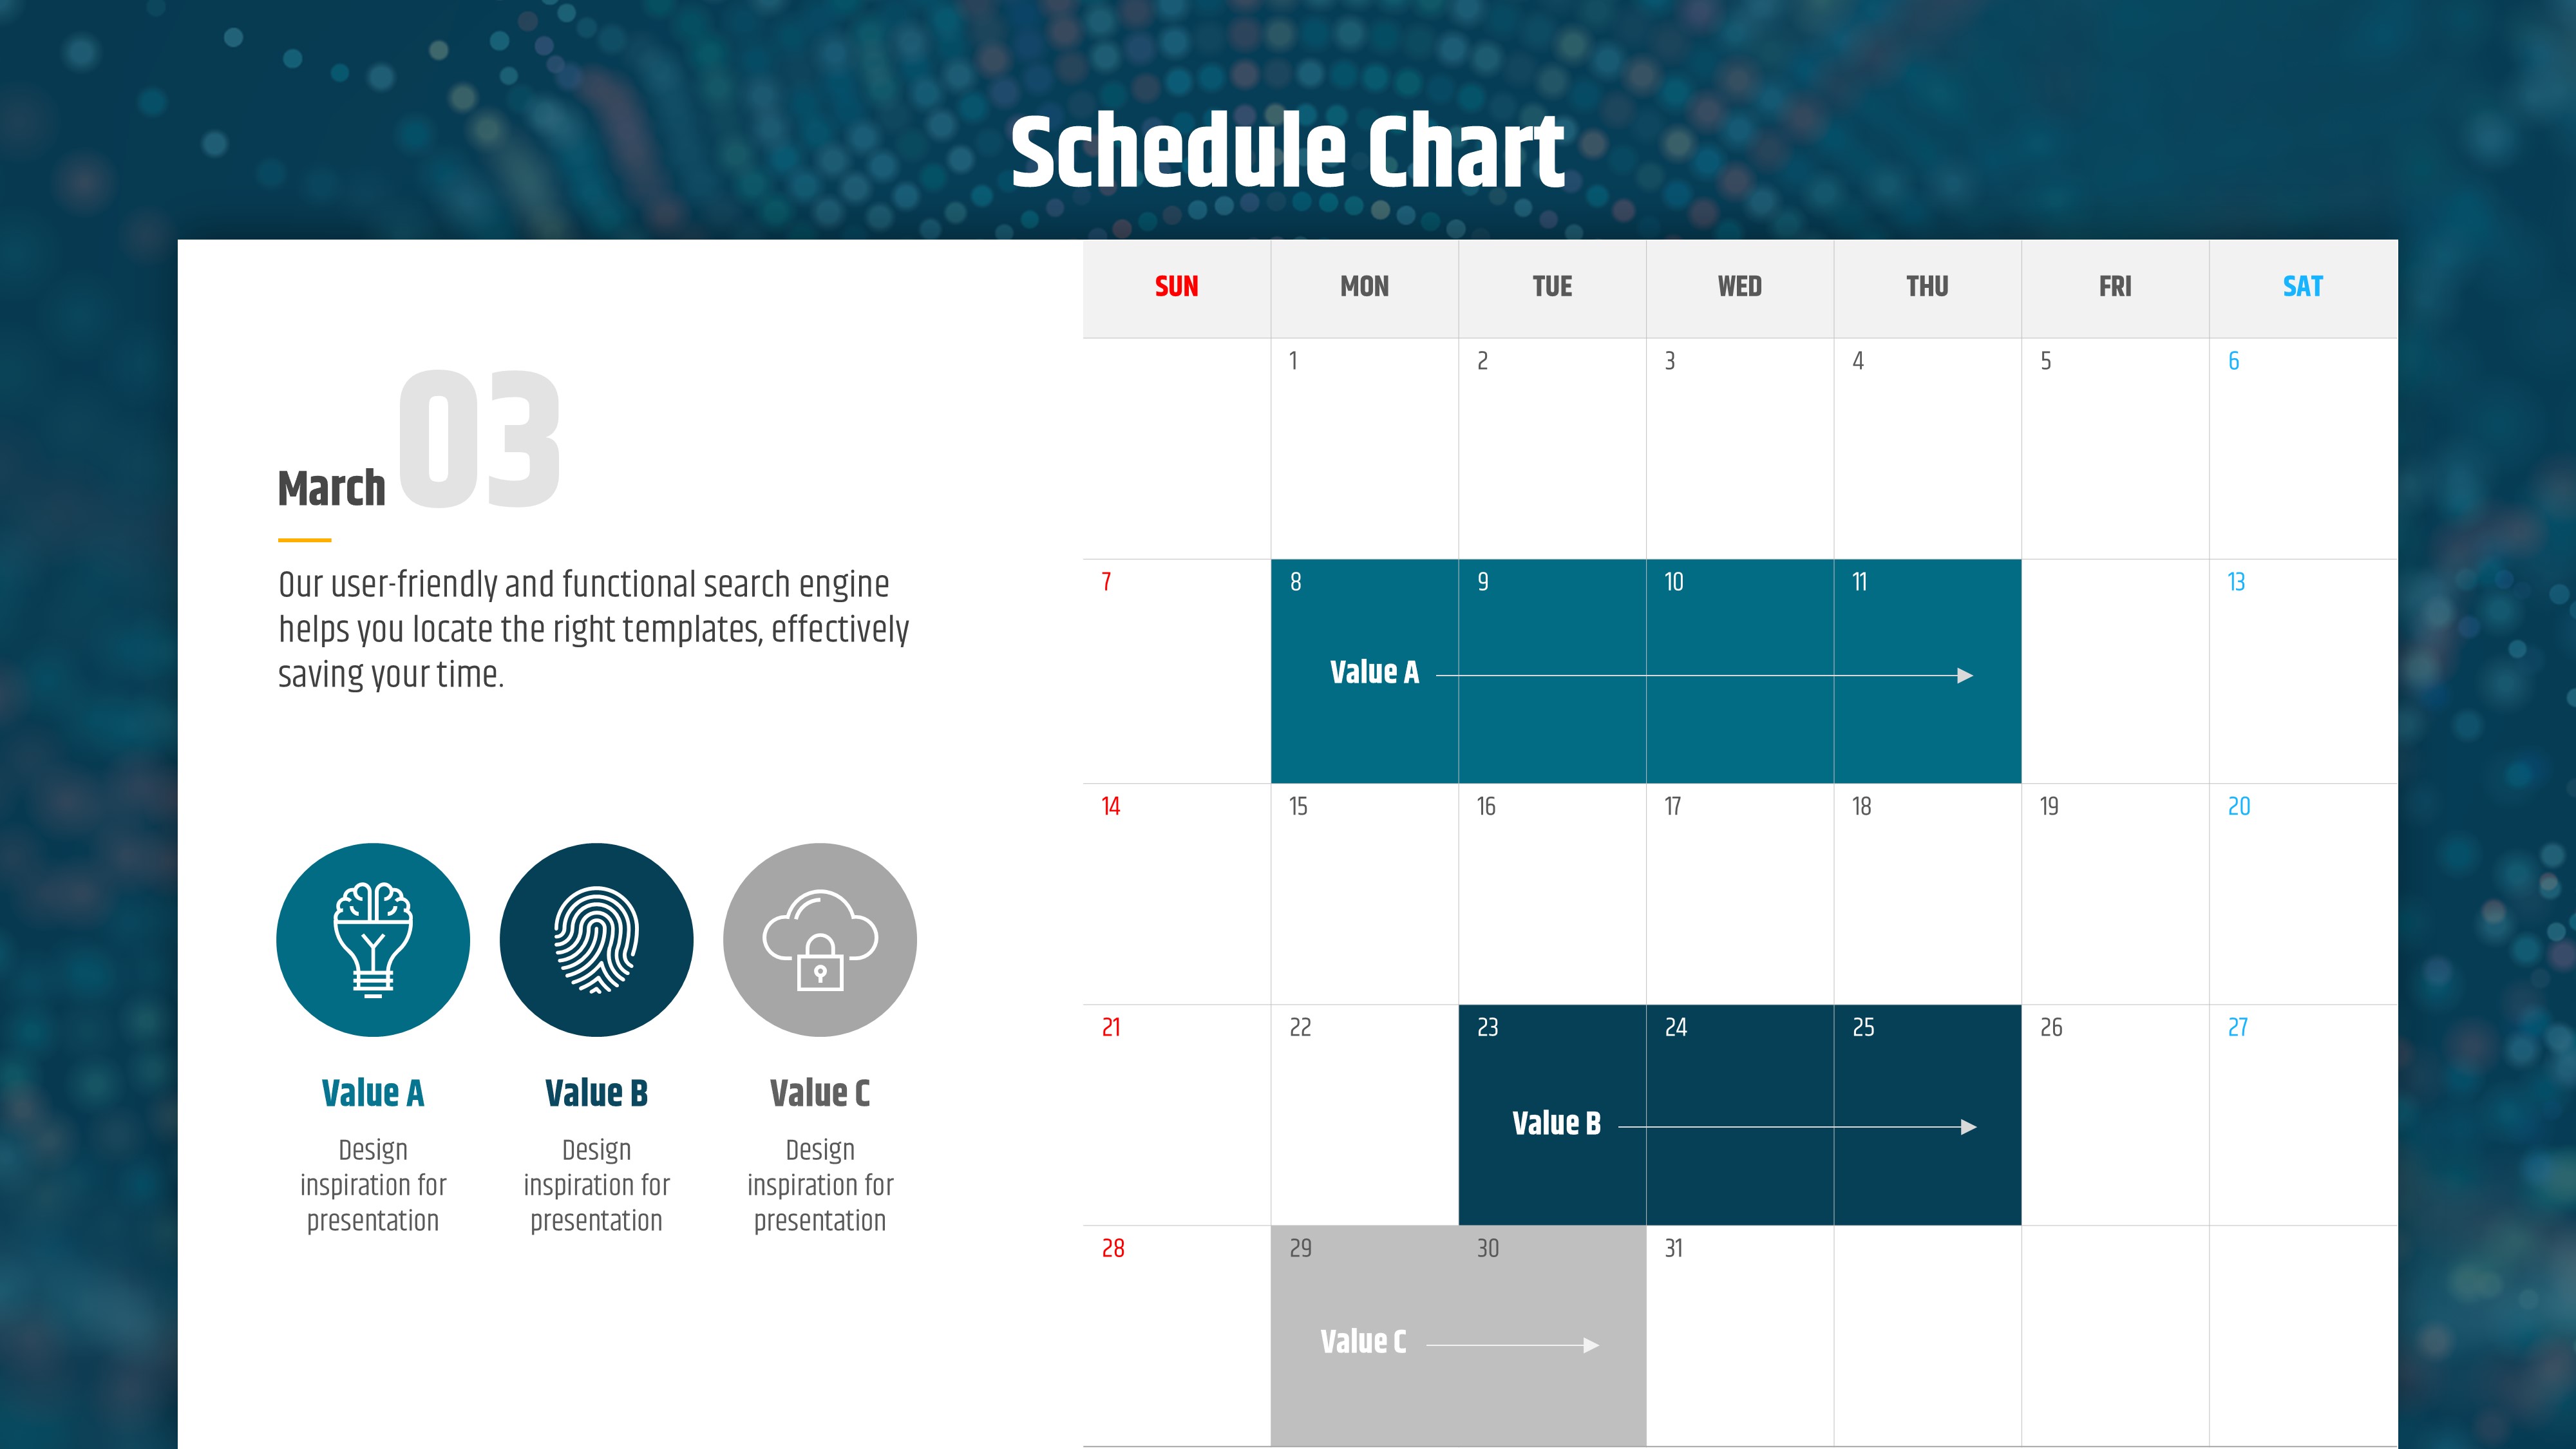
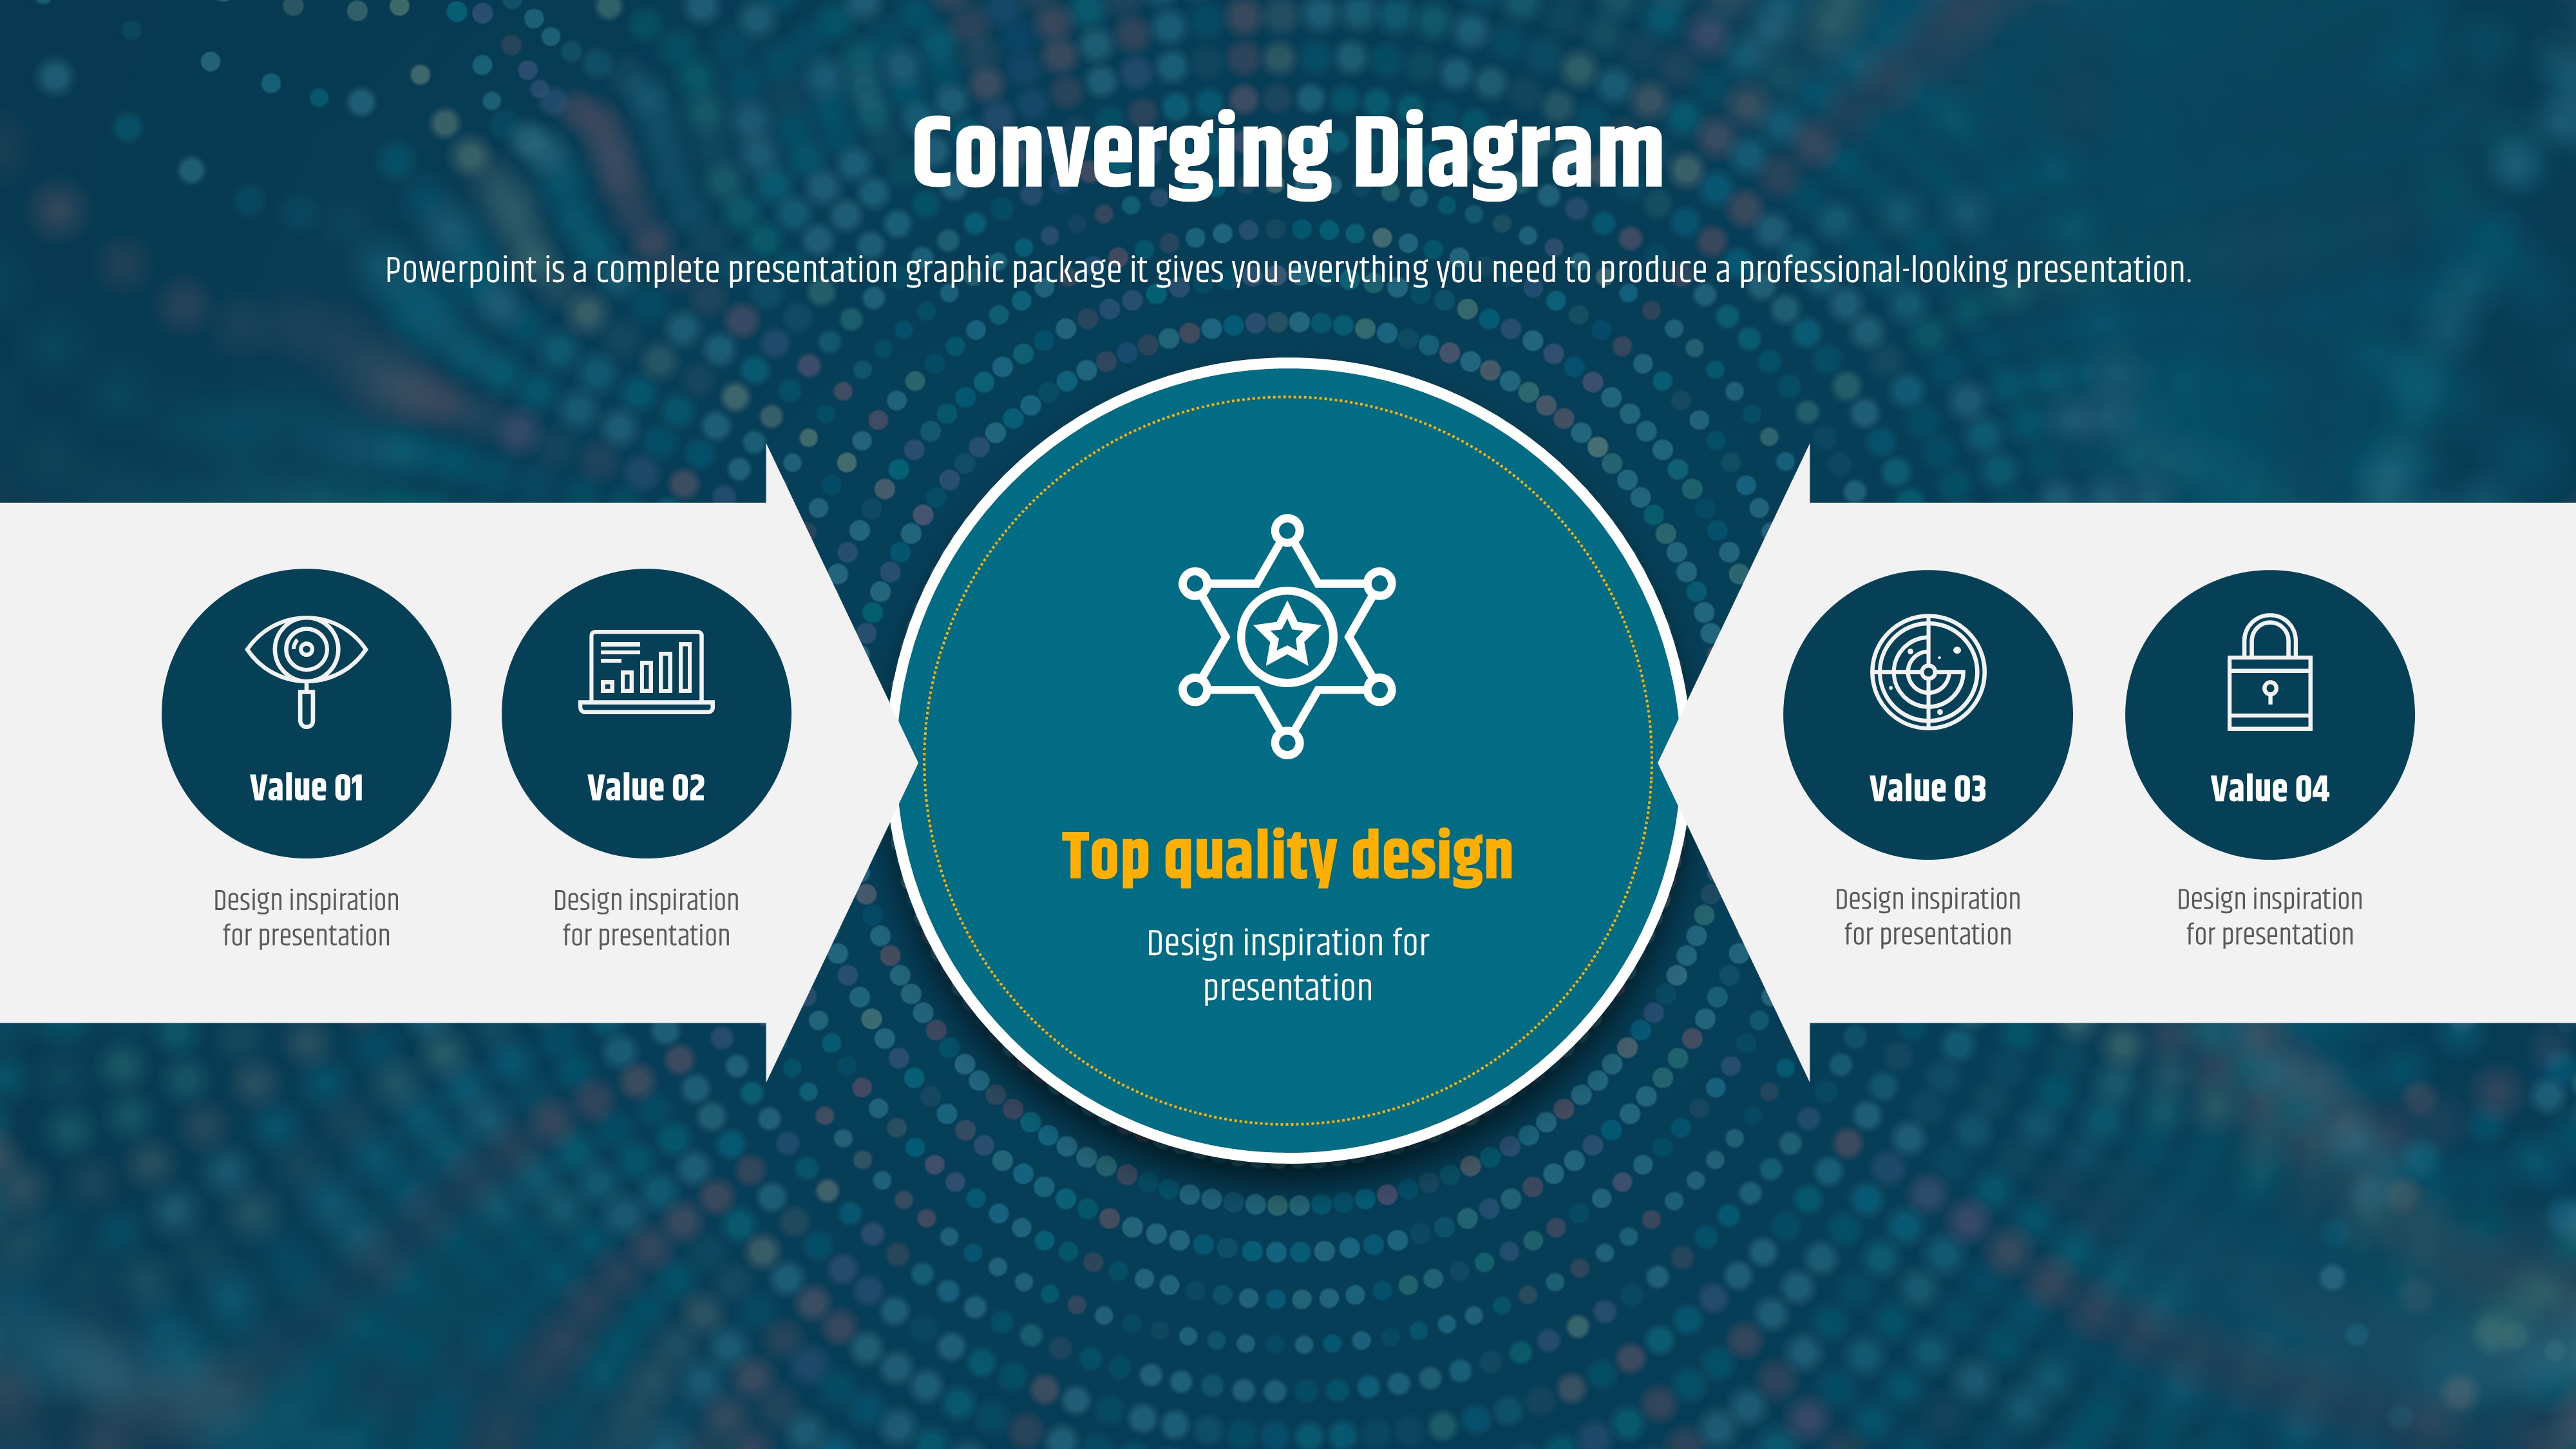
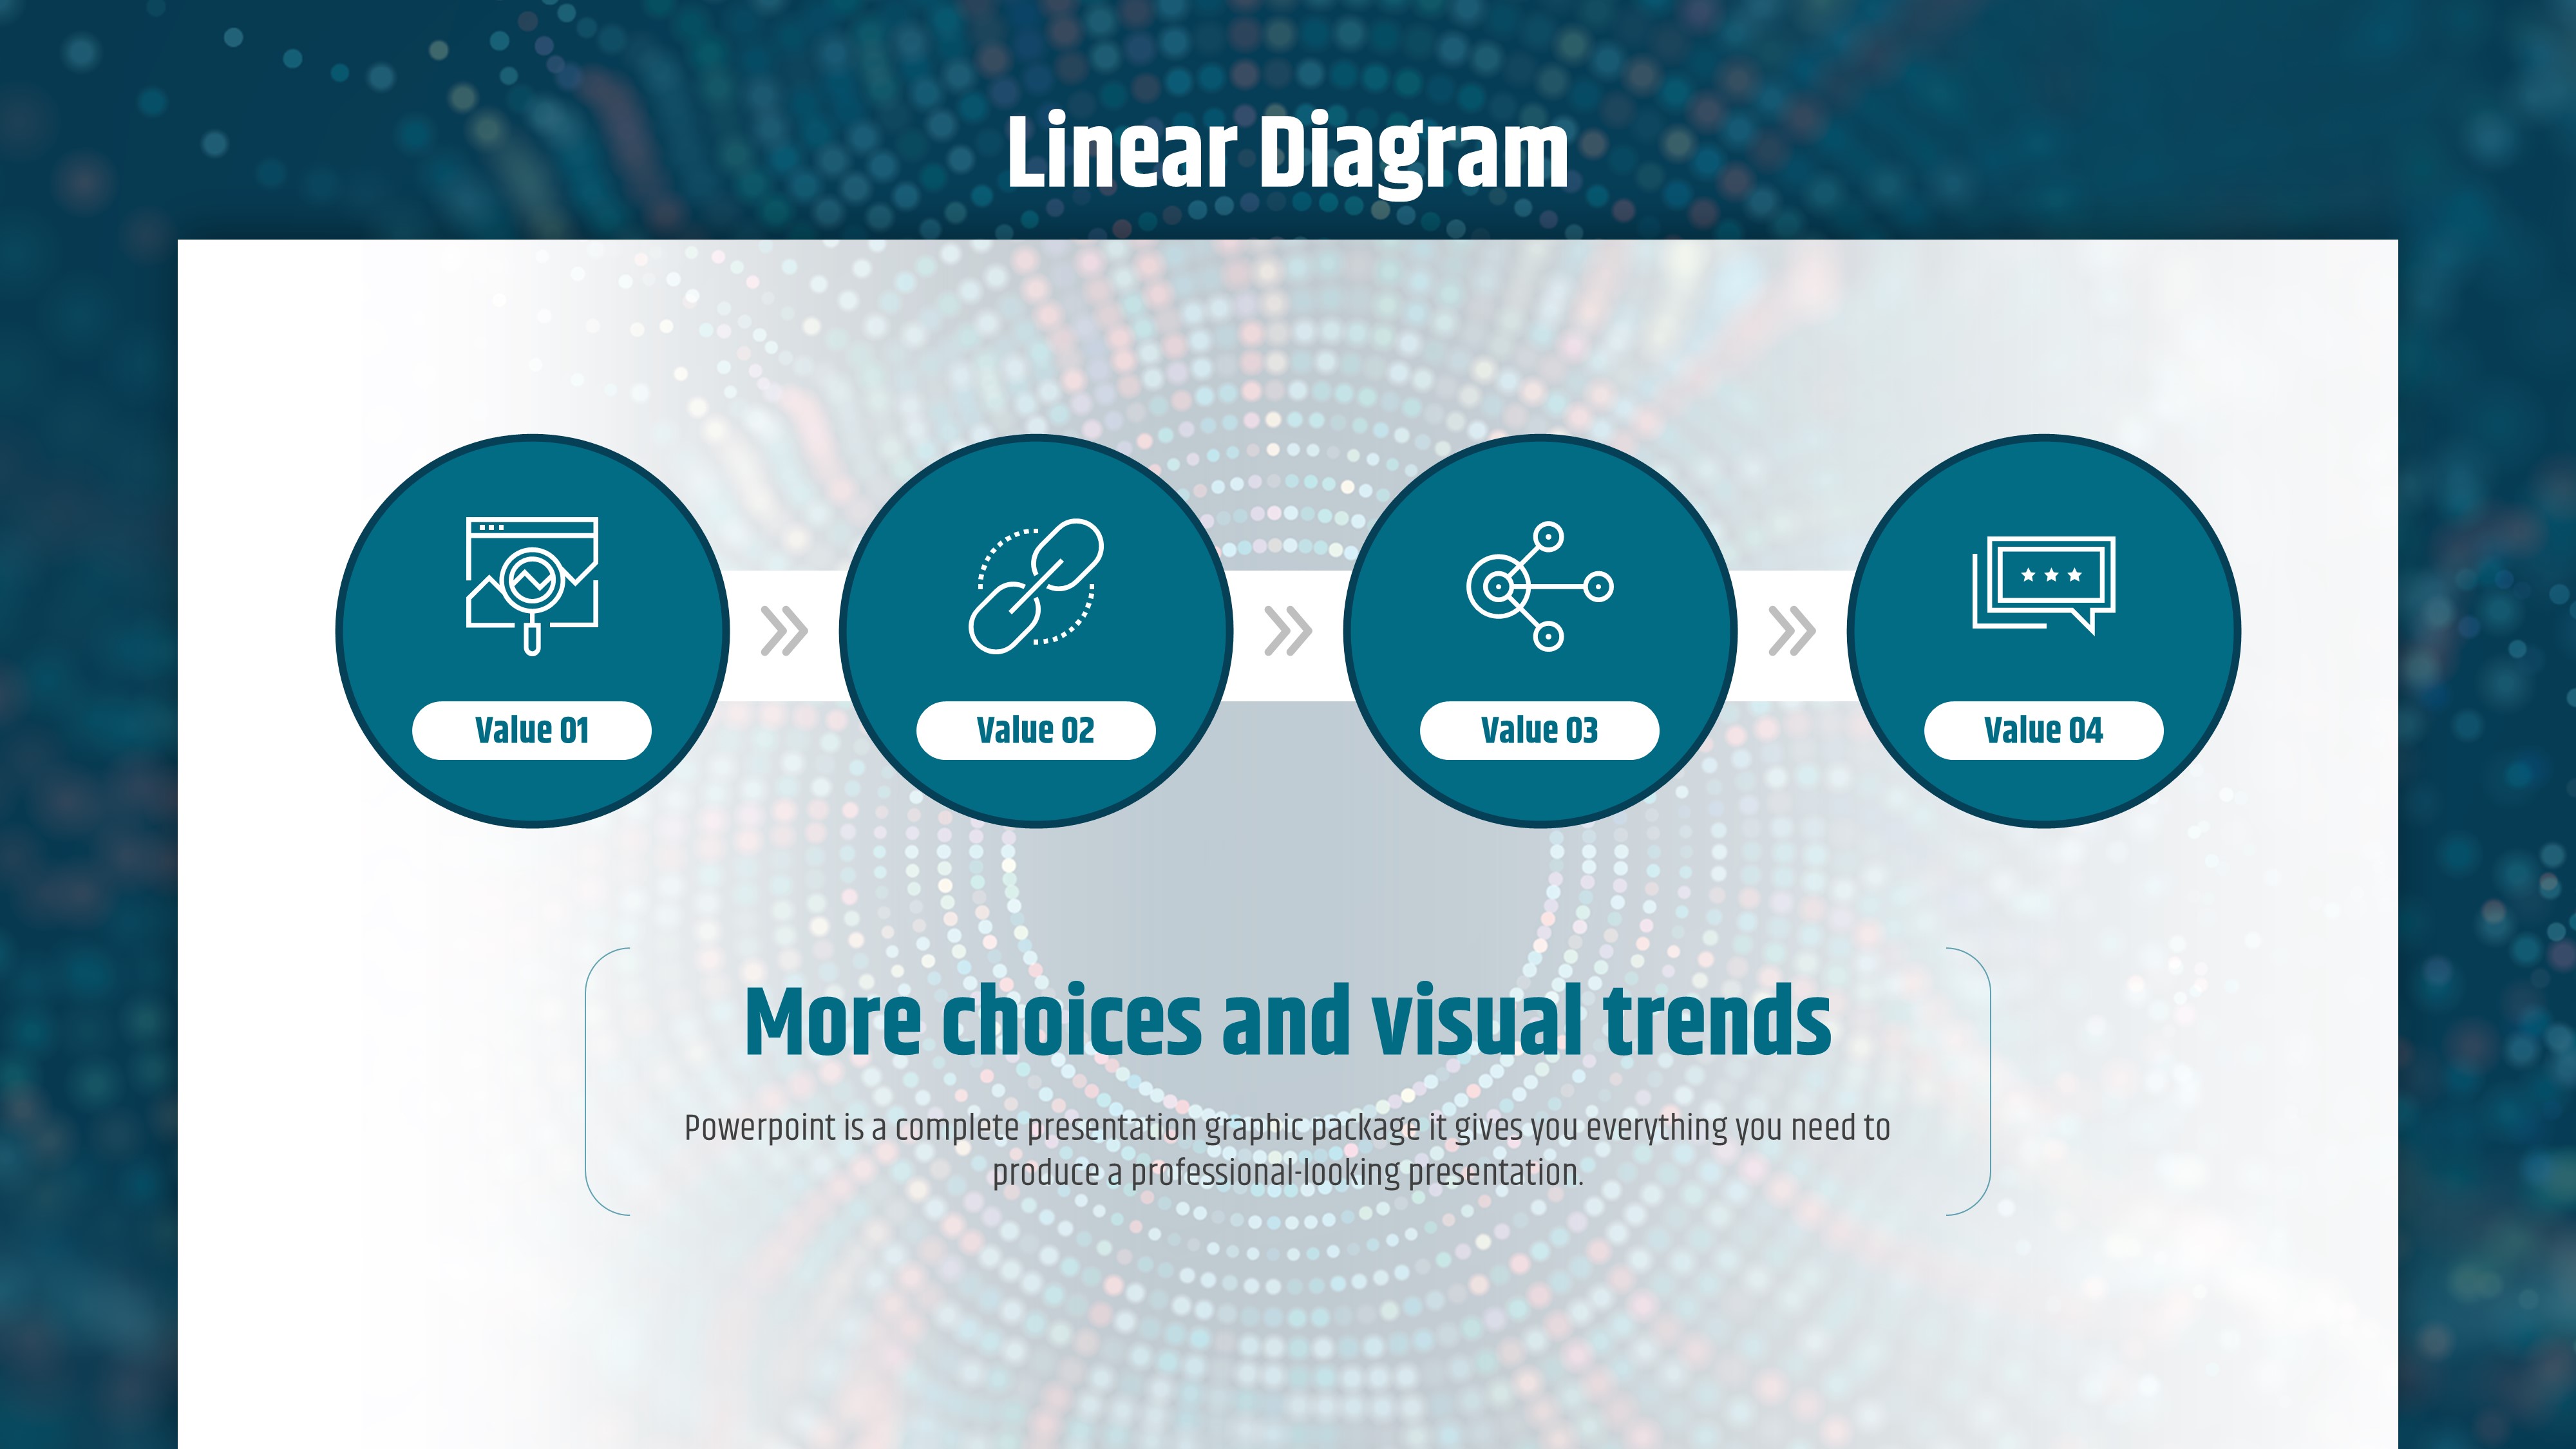
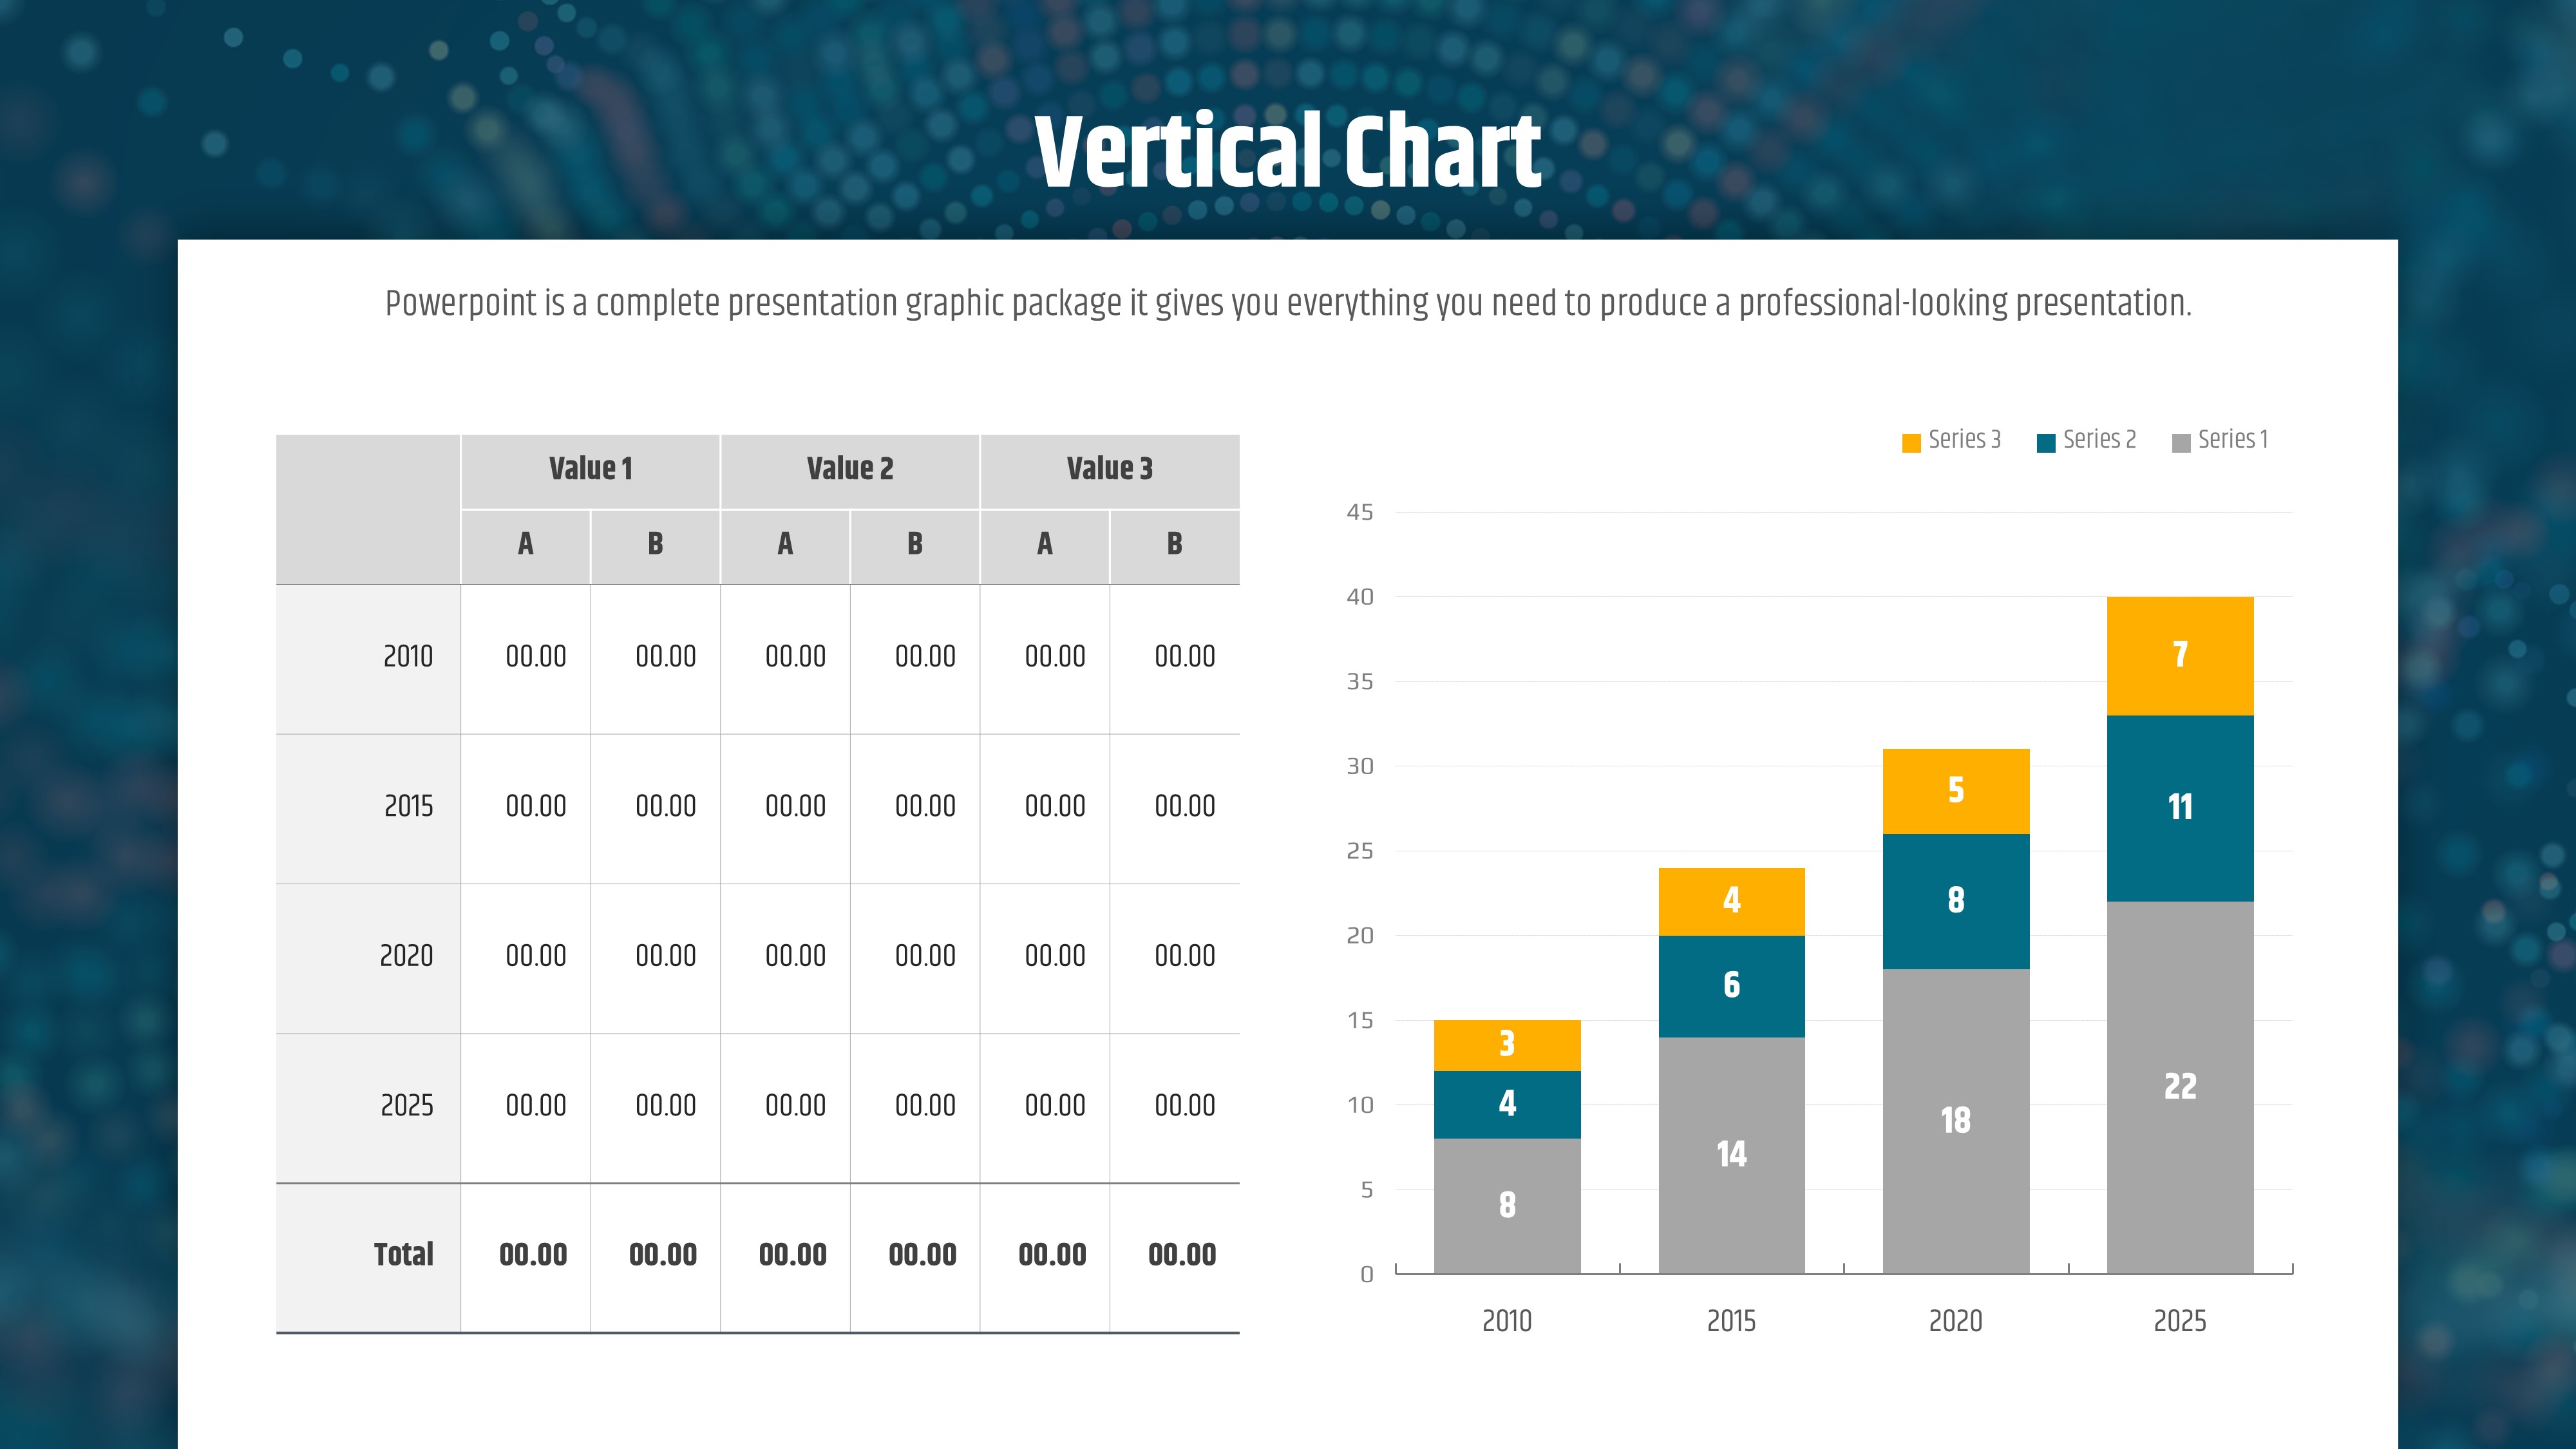
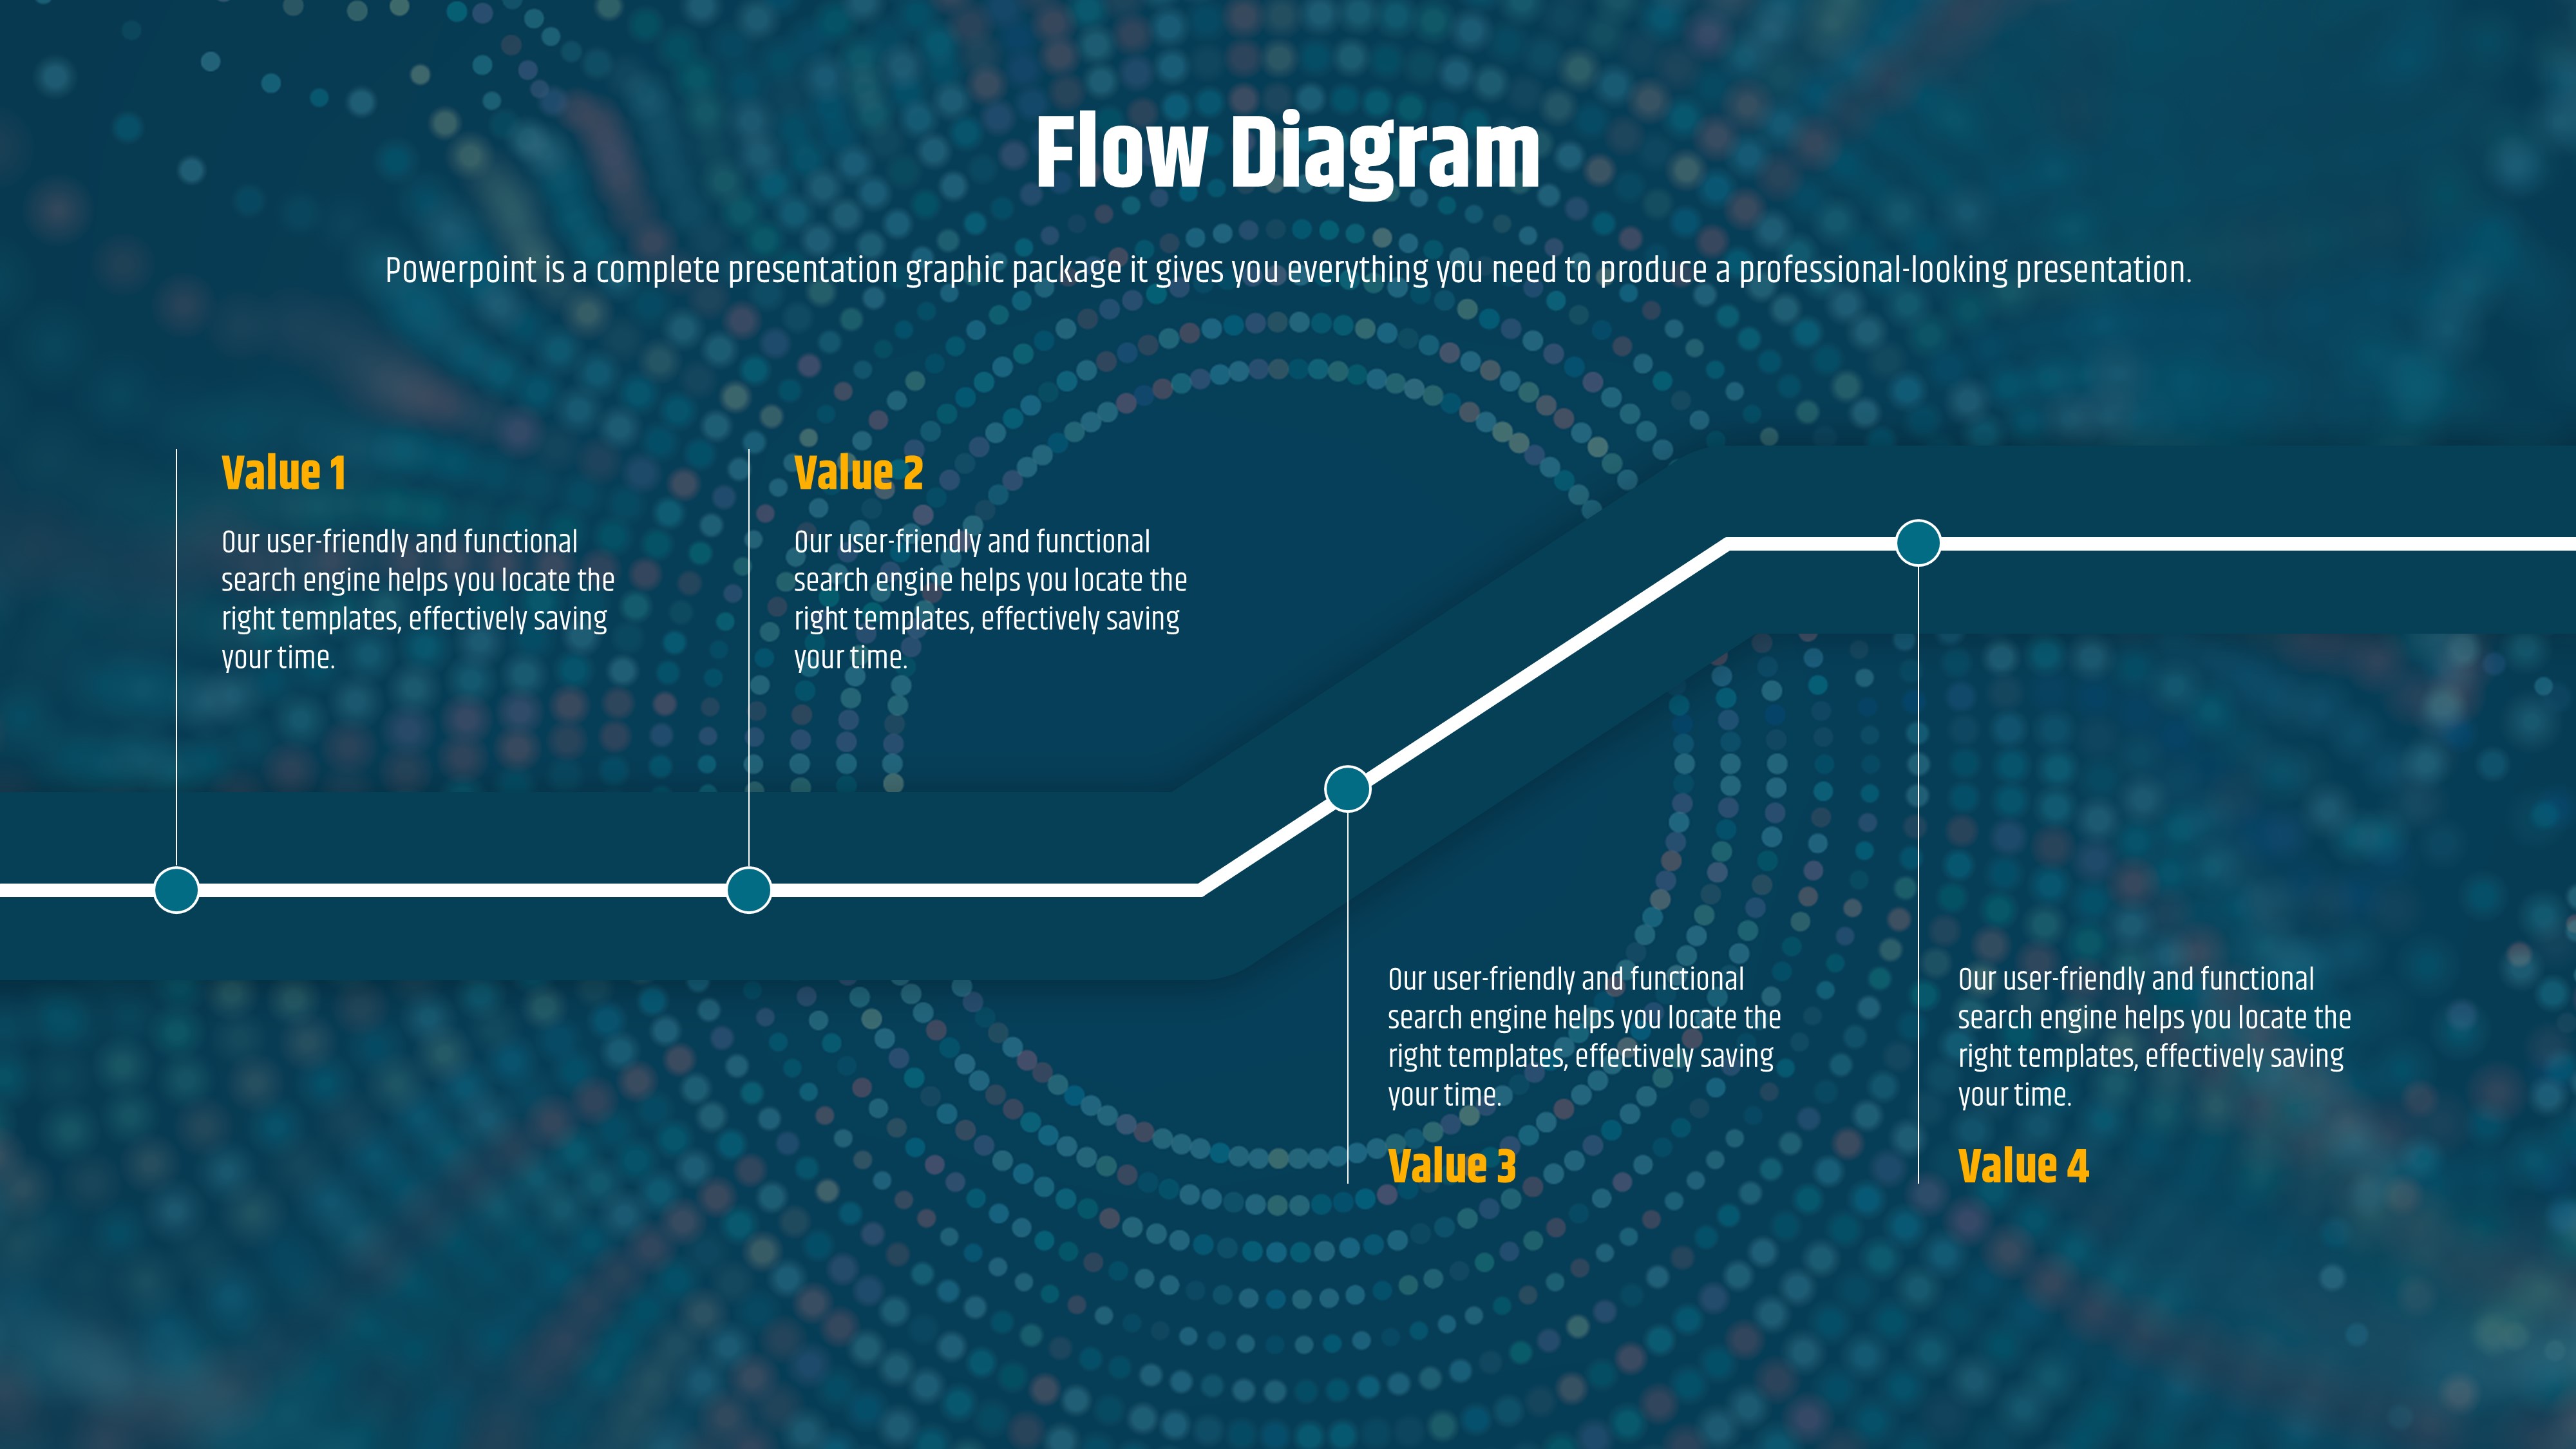
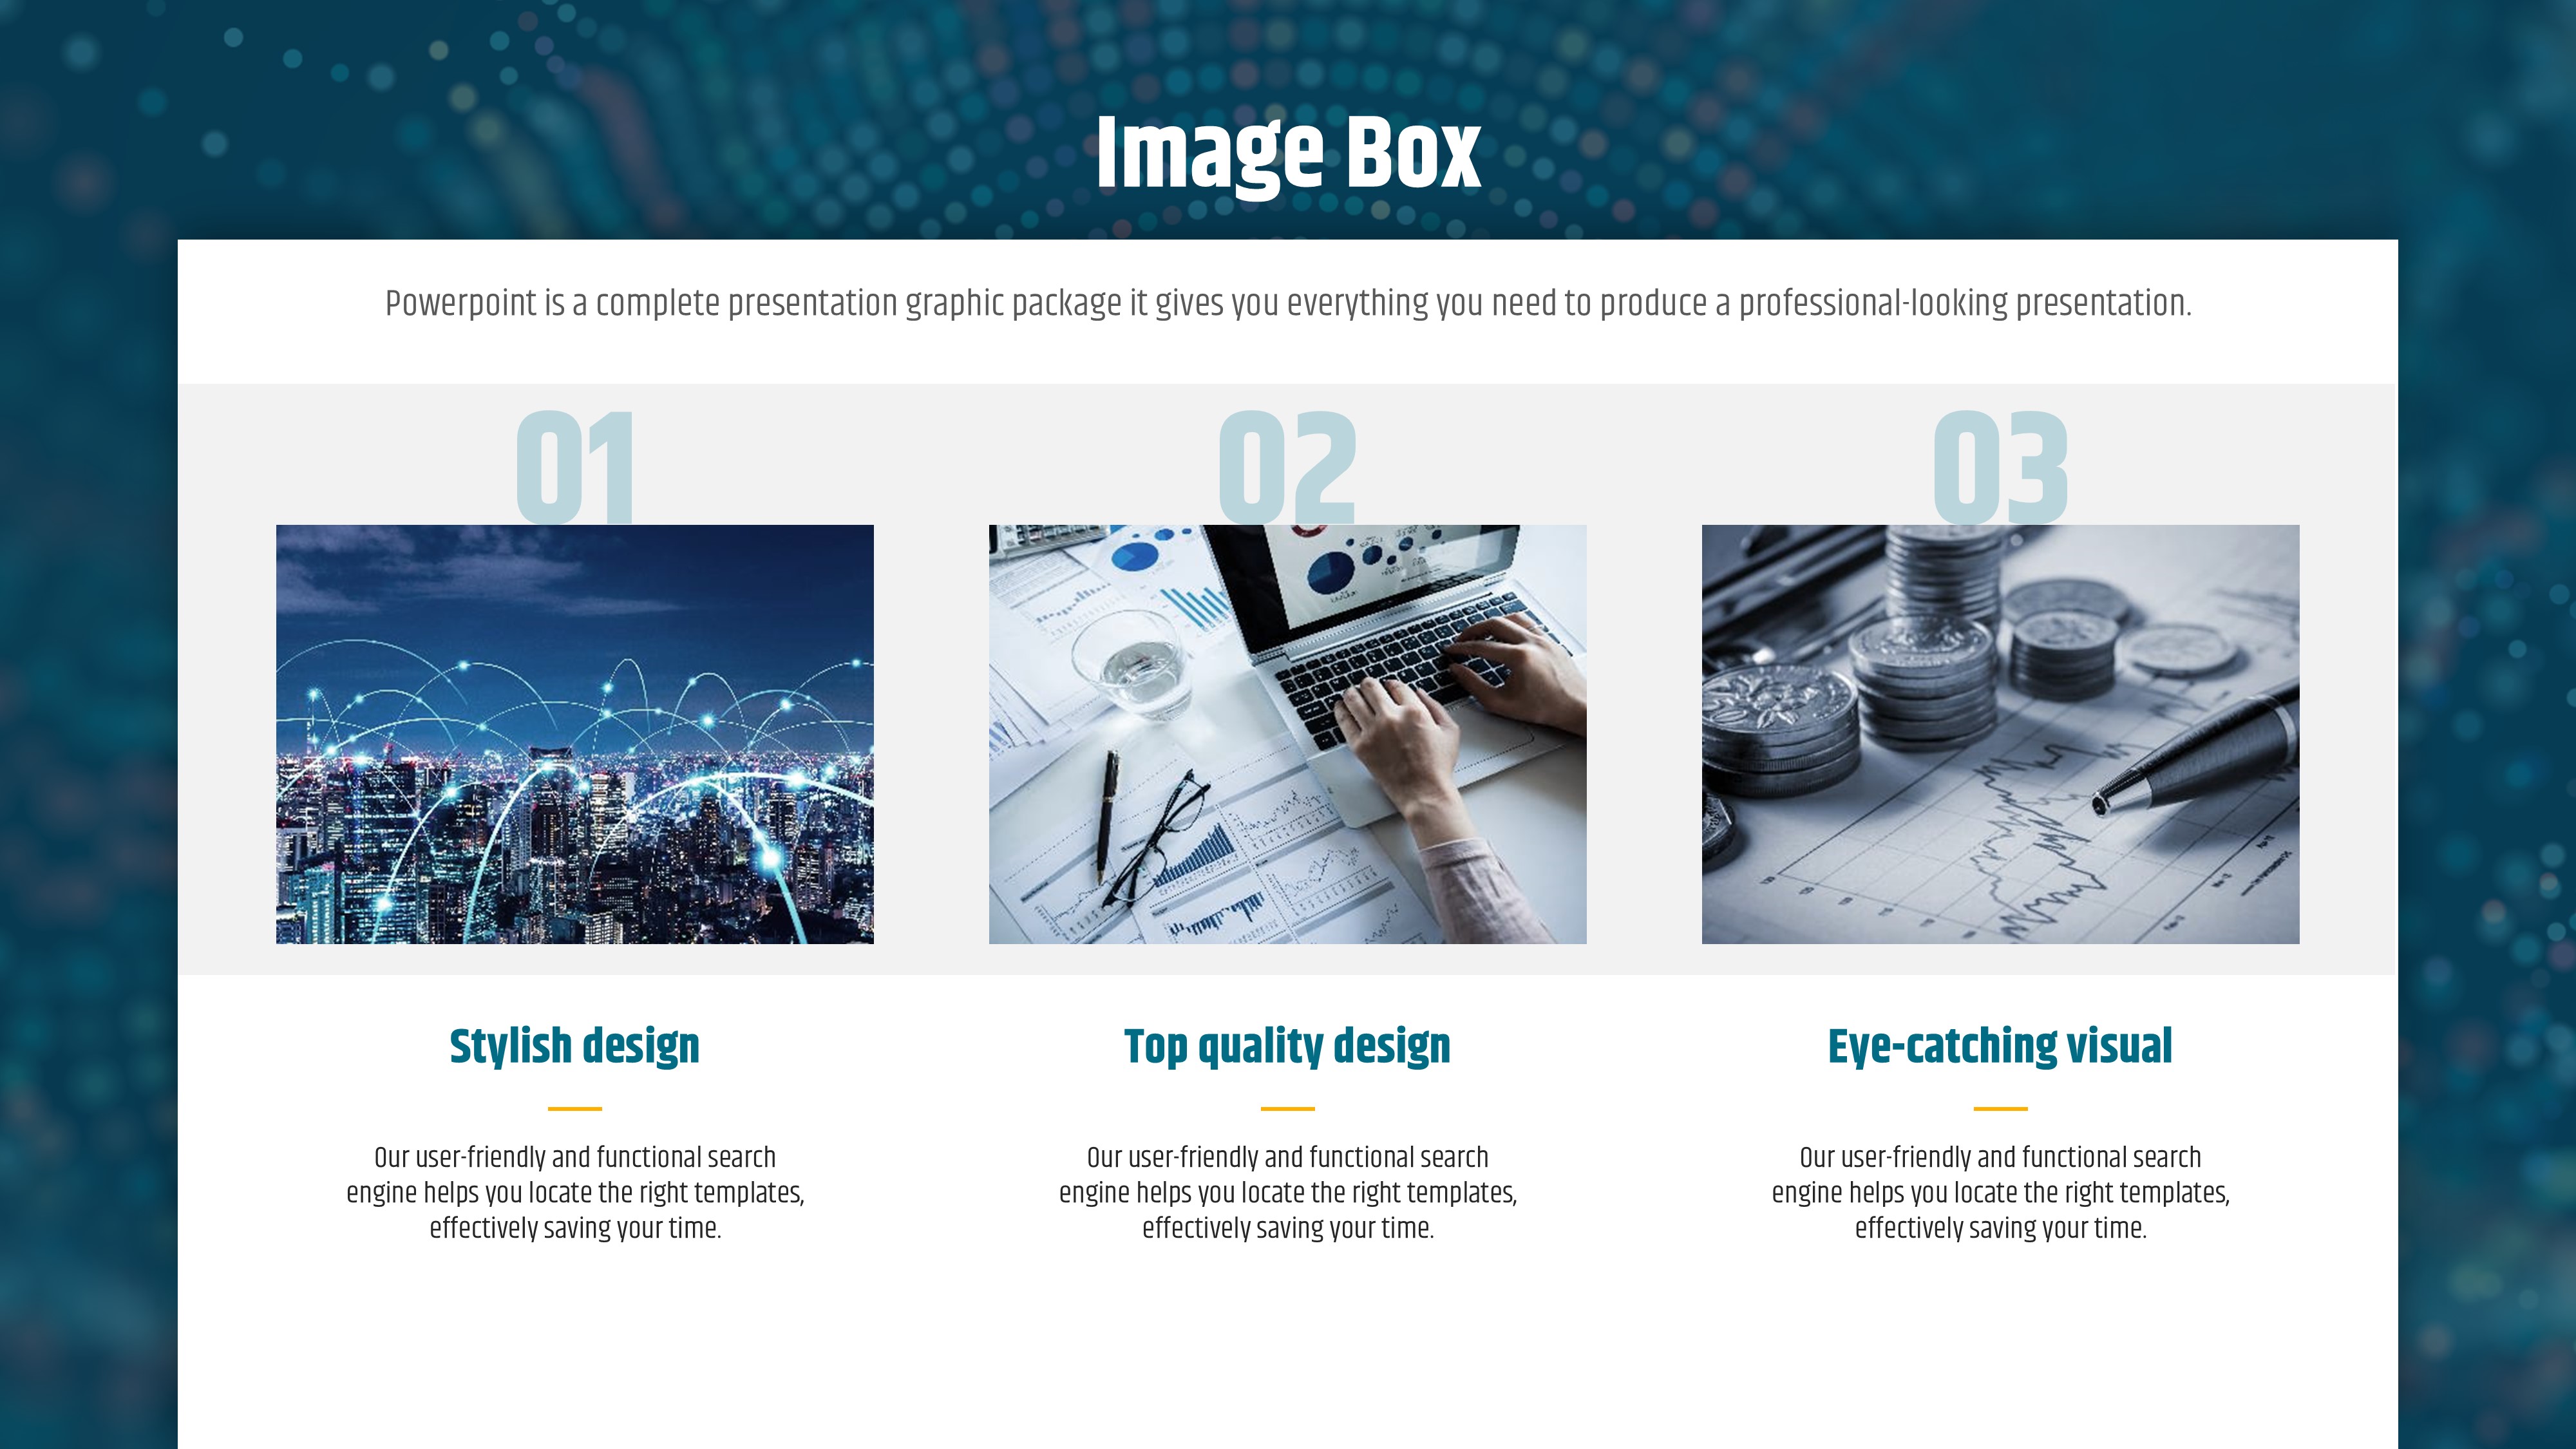
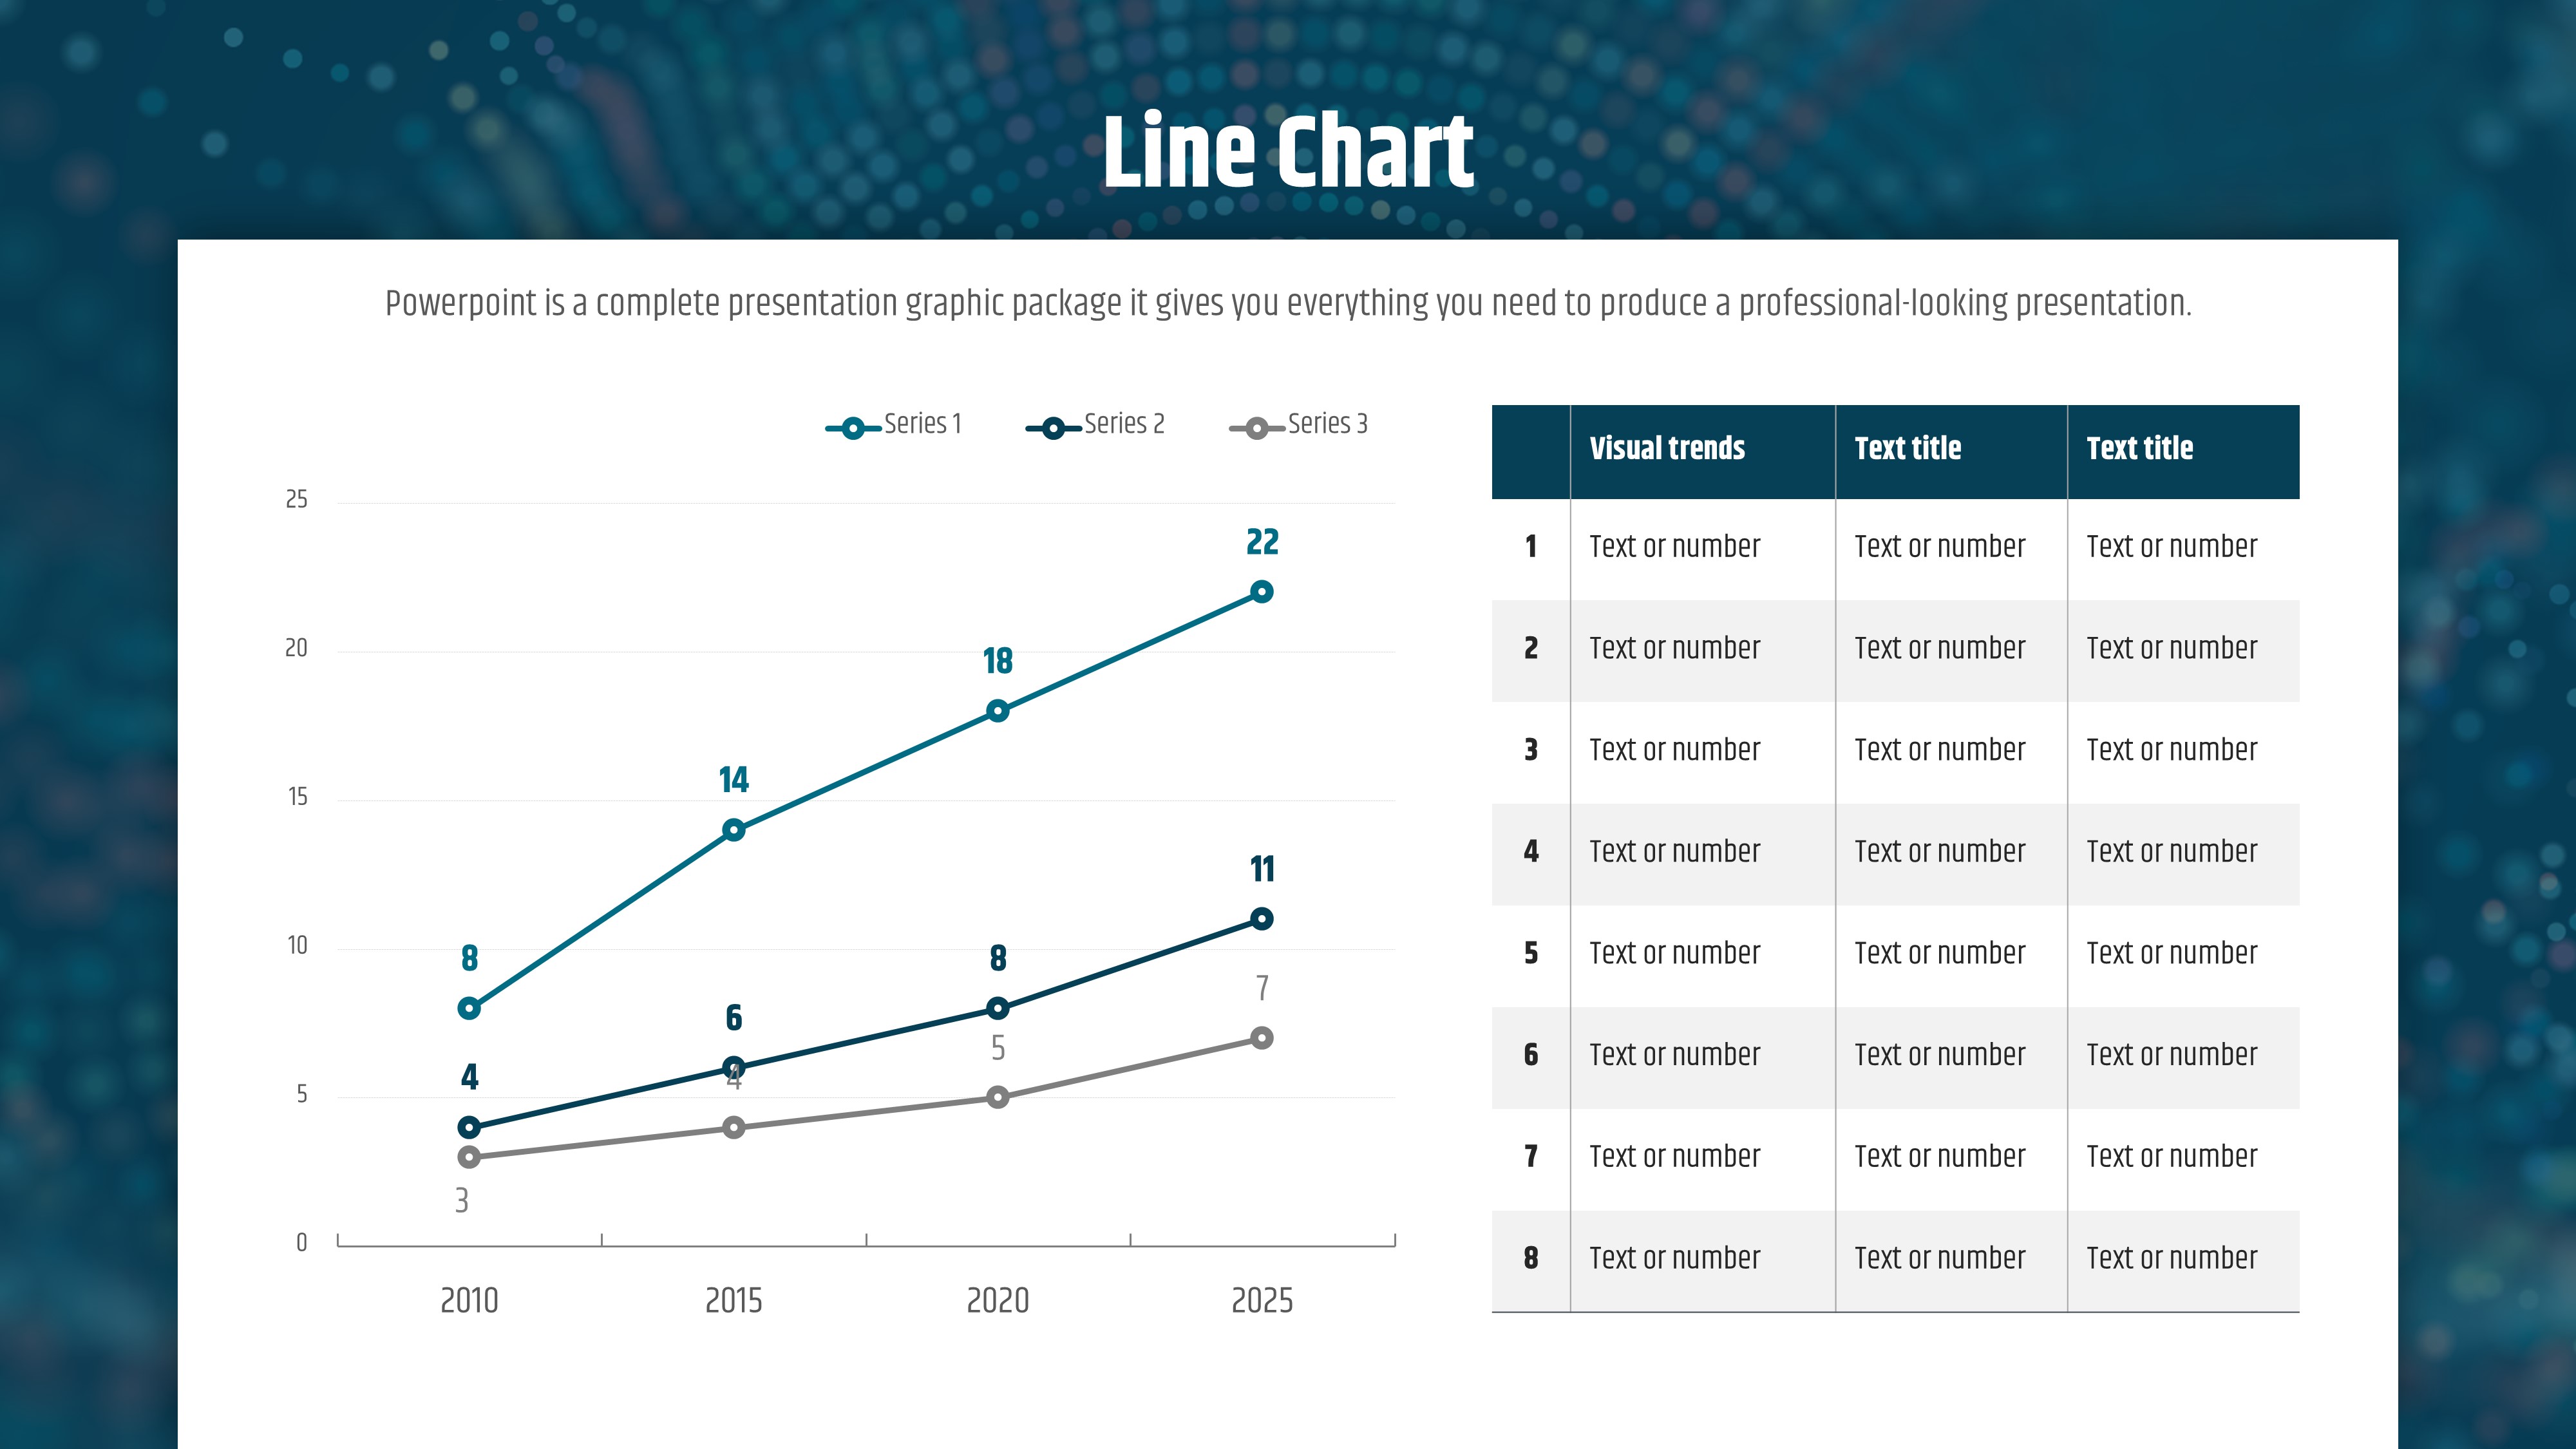
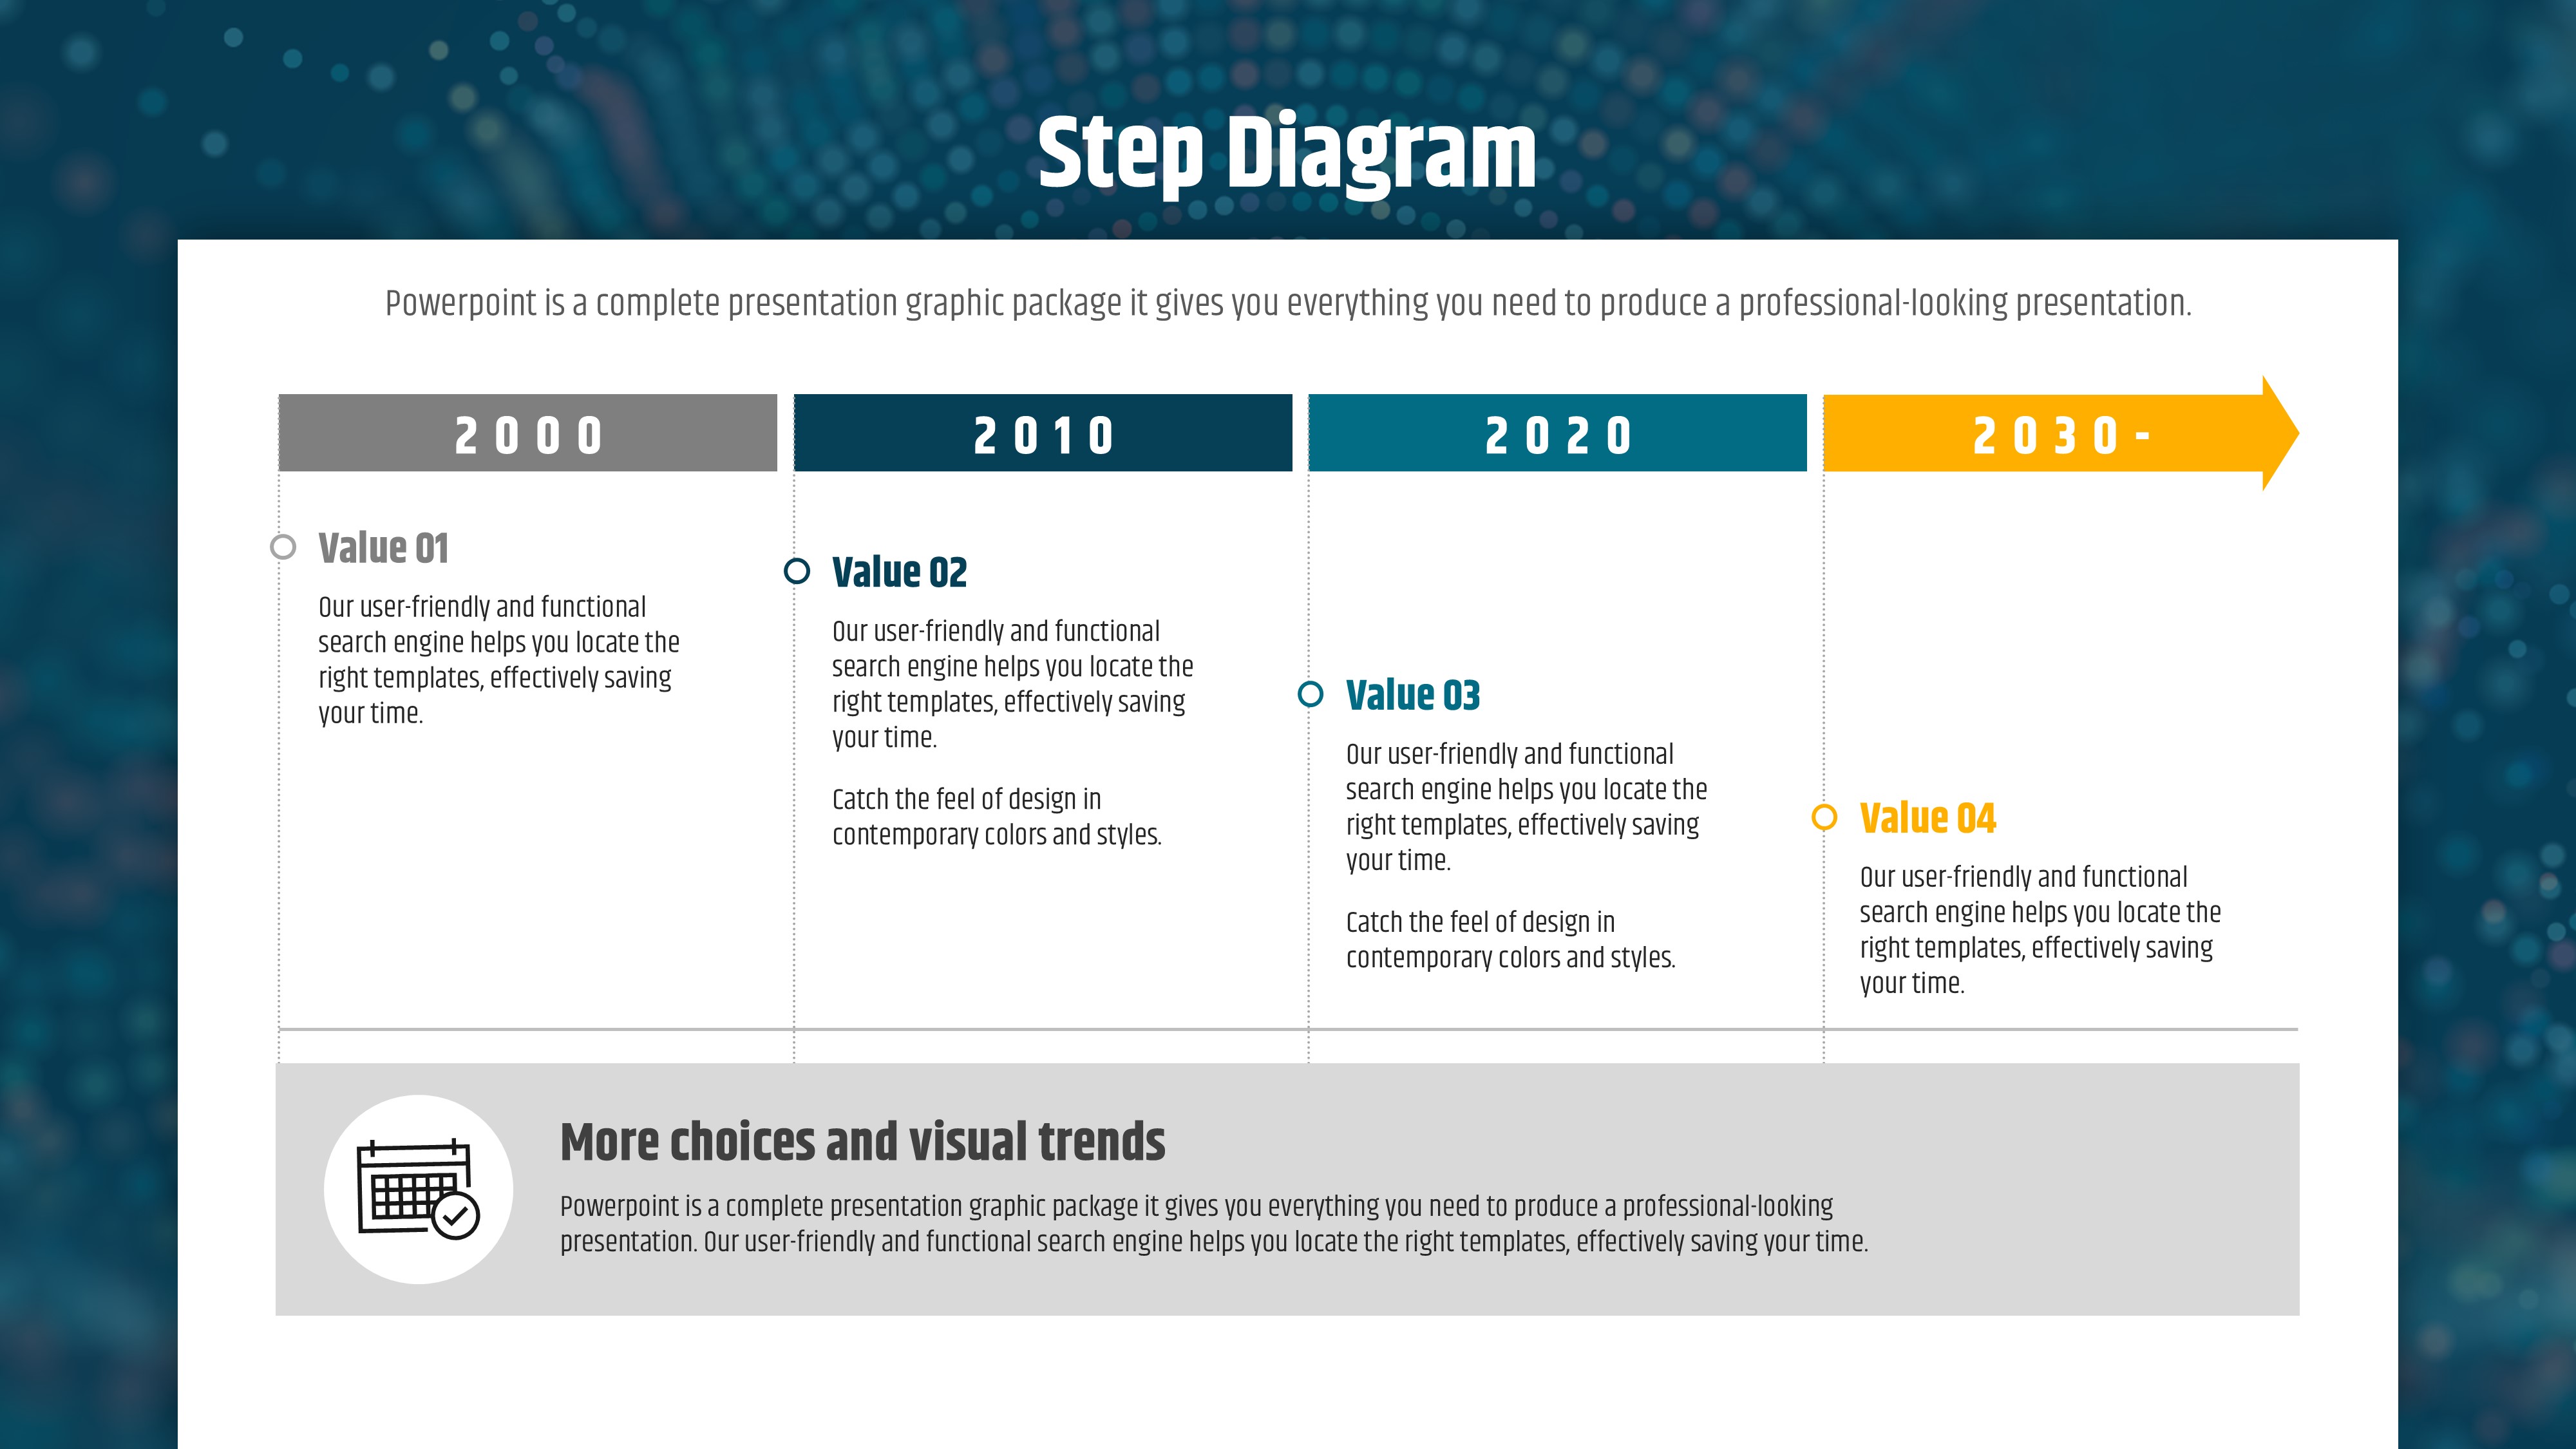
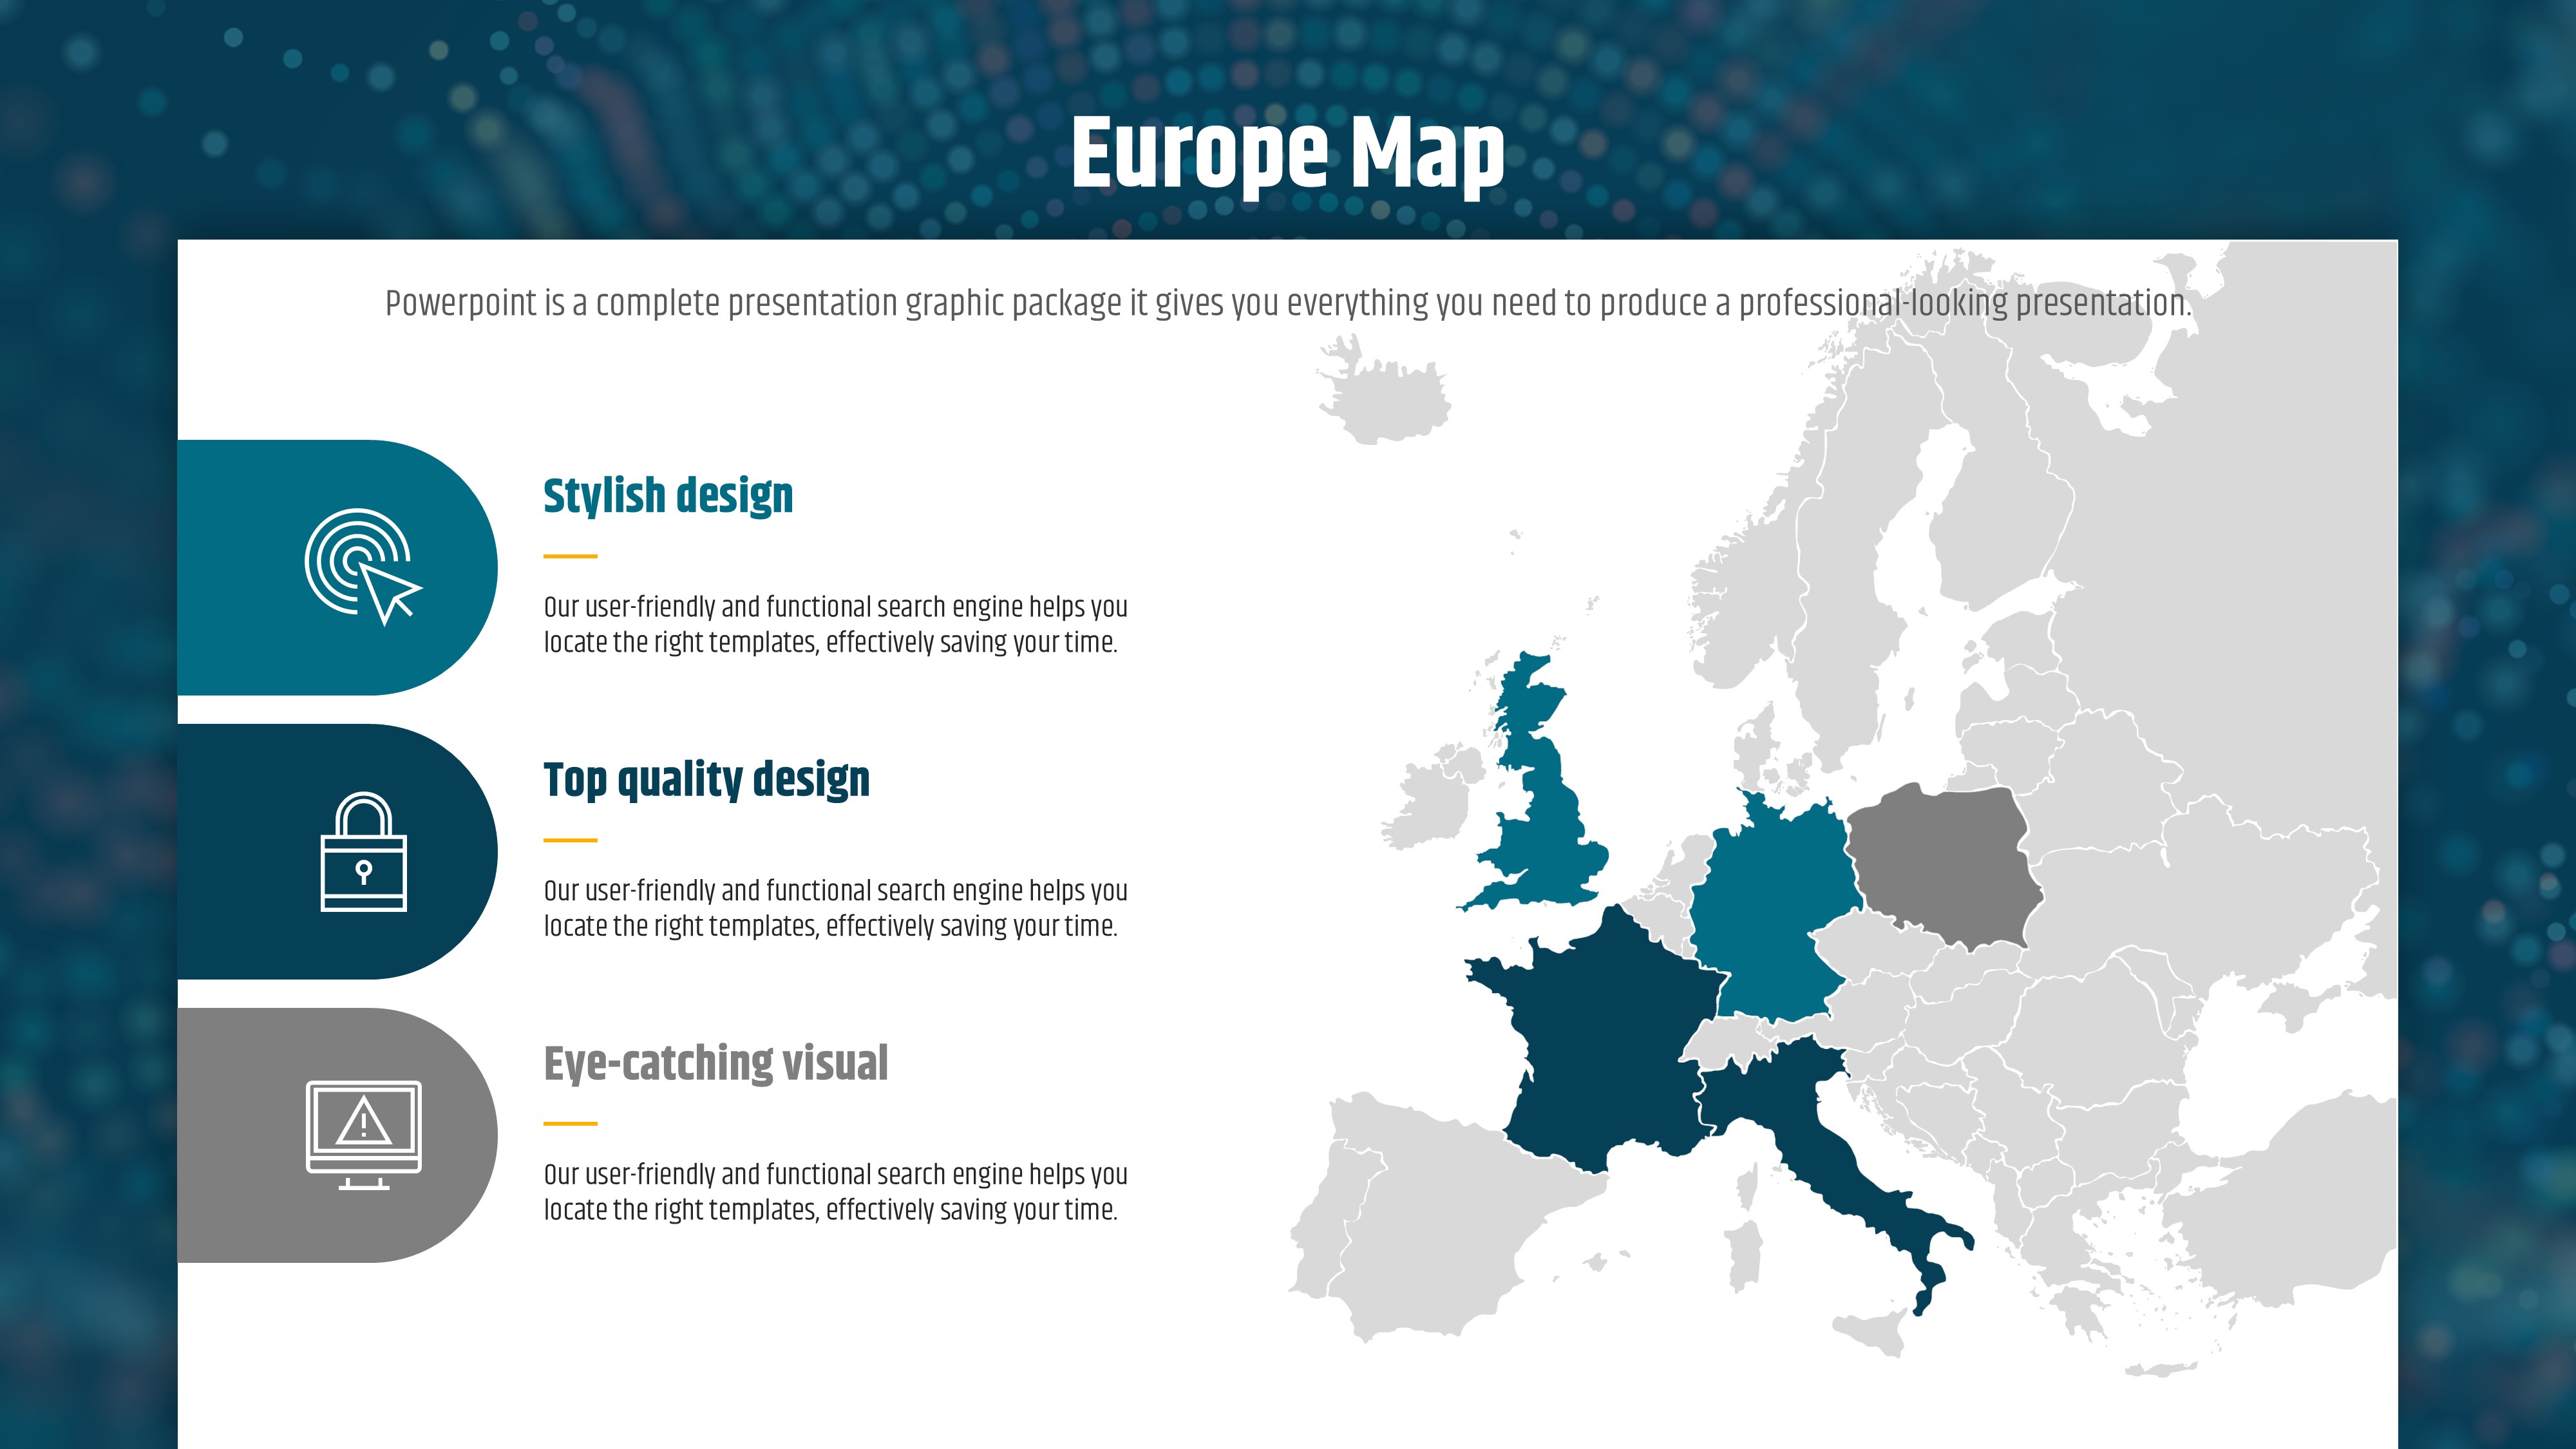
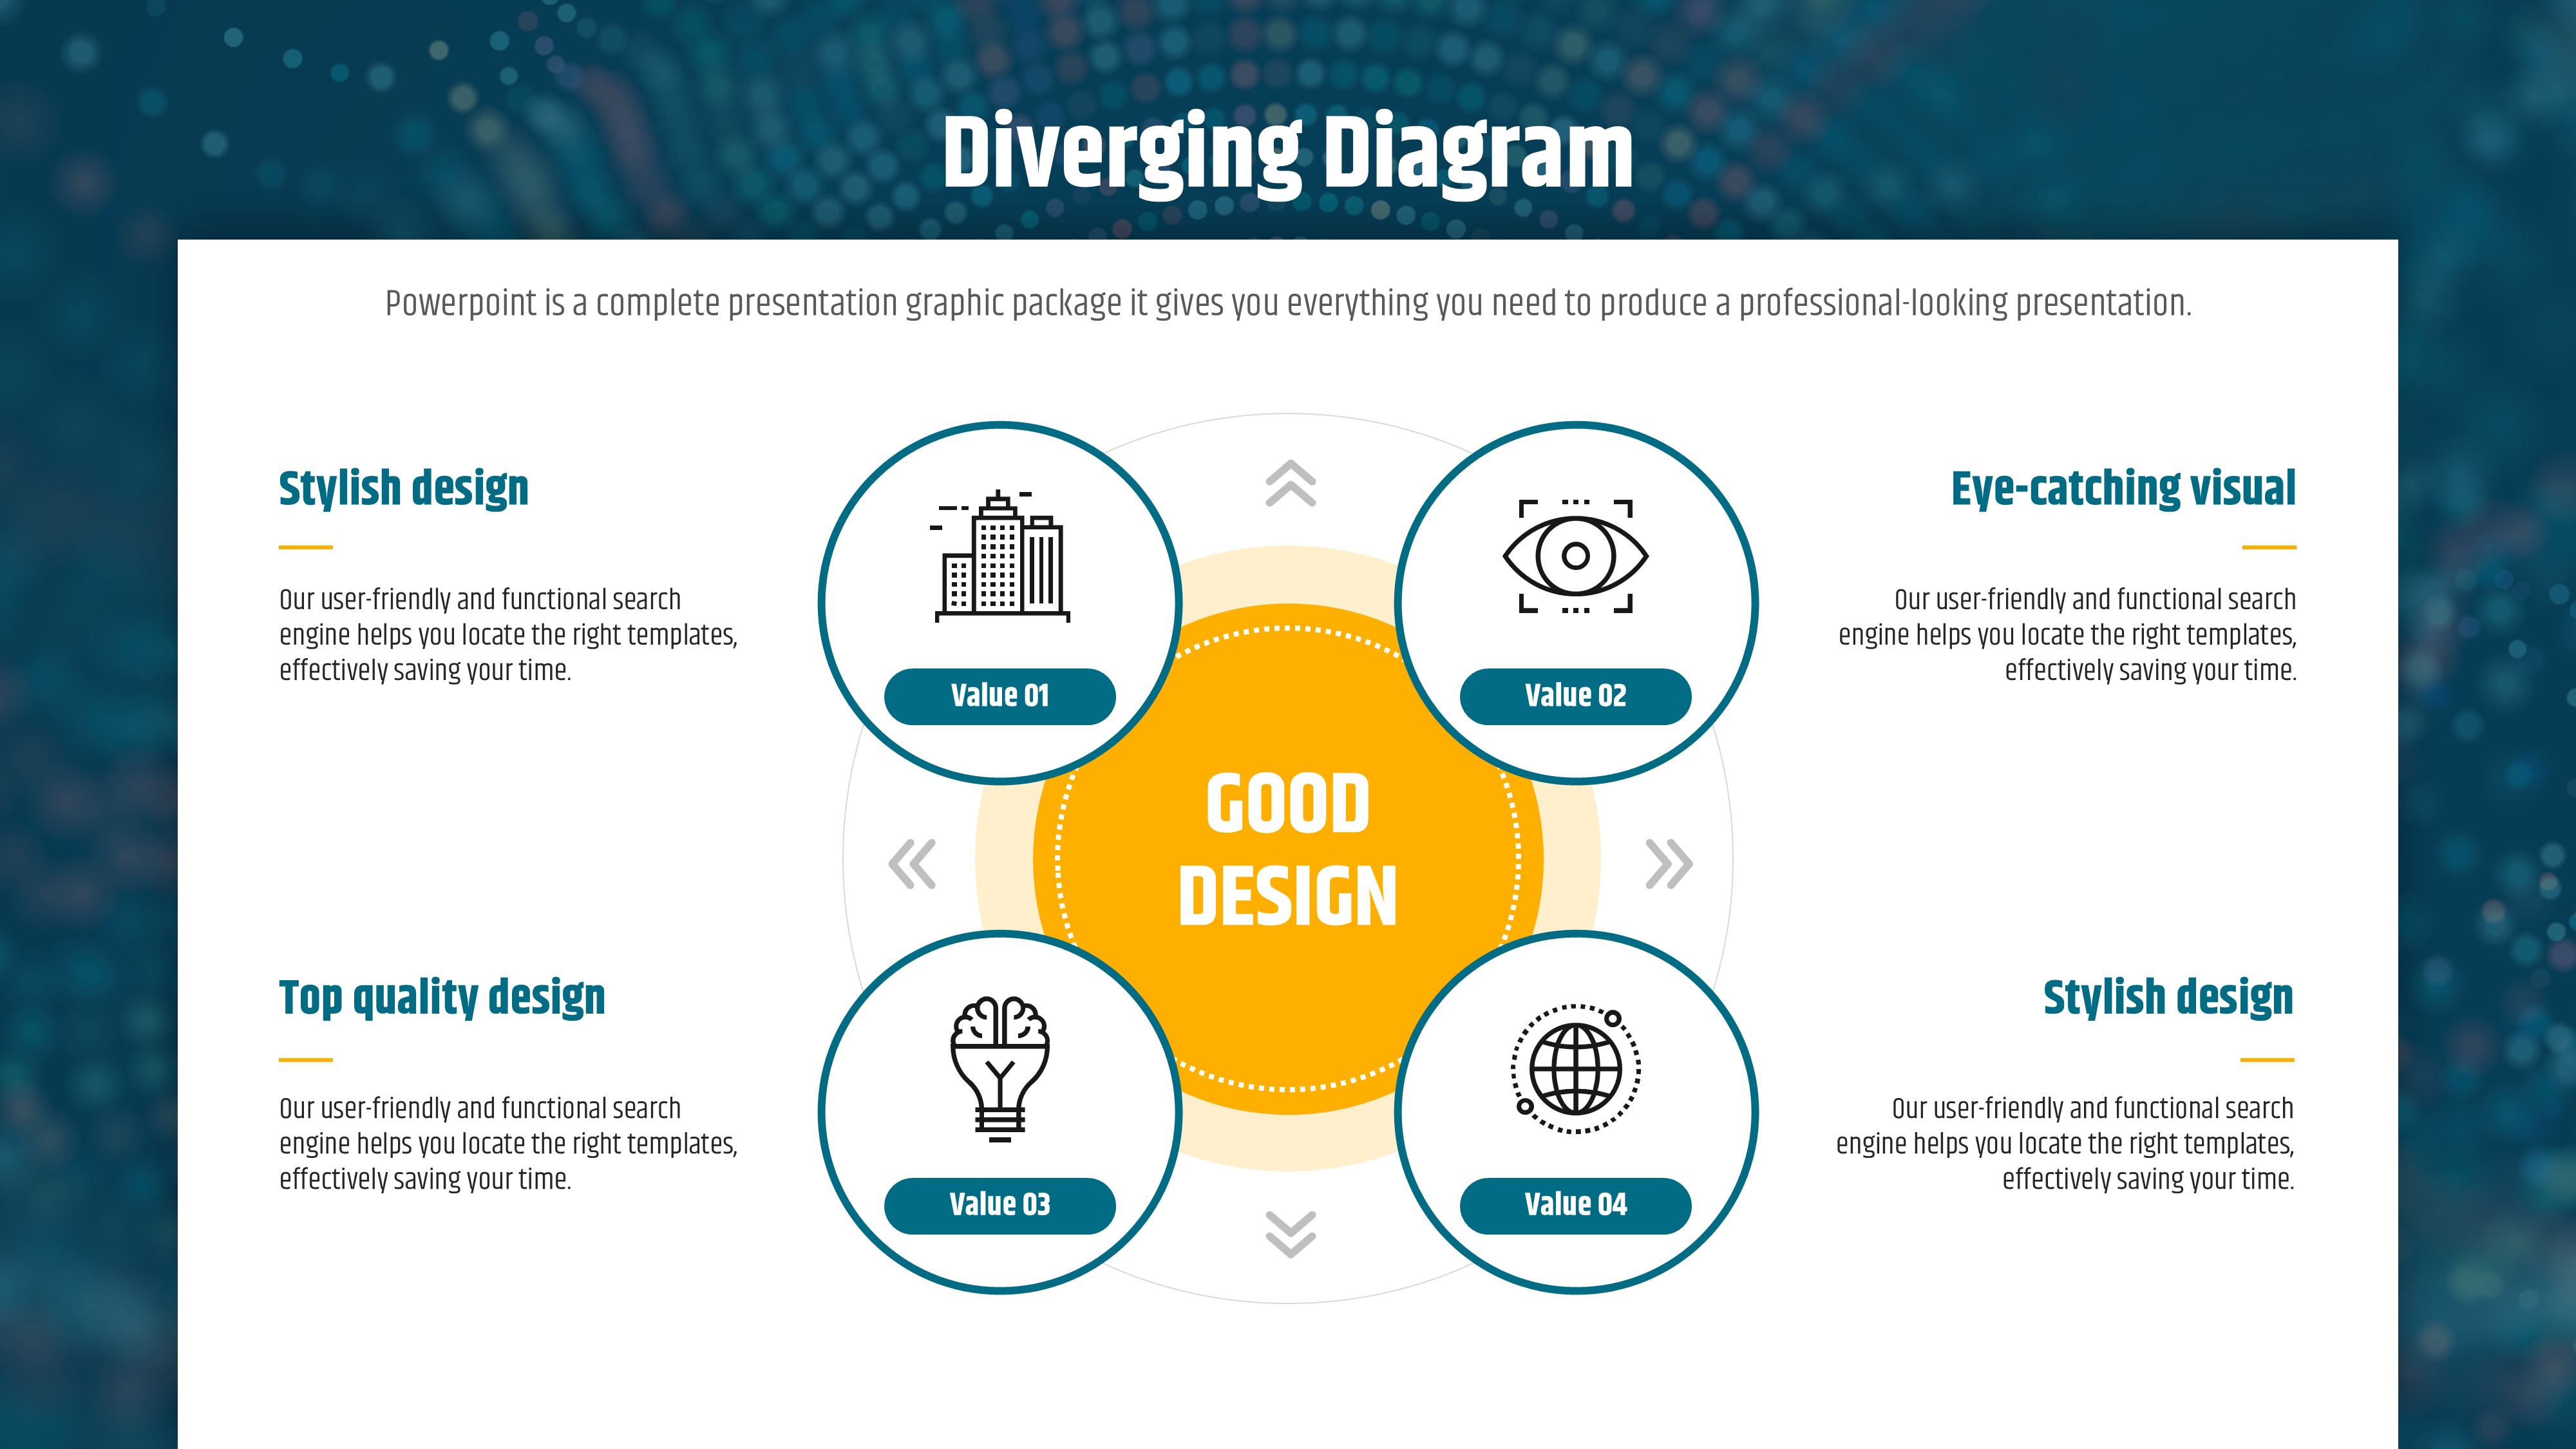
This big data PowerPoint template combines a deep teal and navy blue background with multicolor dot particle graphics to deliver a strong data-driven visual identity for IT presentations. The white main layout paired with orange and yellow accent colors makes data flow intuitive and easy to follow, while the balanced two-column grid keeps text and visuals in harmony across every slide. The 31-slide PPT deck includes converging and diverging diagrams, clustered column and line combo charts, a step timeline from 2000 to 2030, and an Asia map slide with pin markers—giving you everything needed for a complete big data or AI presentation. All slides are fully editable in PPTX format, so you can update text, figures, and colors to match your brand or project. Whether you are presenting a big data service, reporting analytics results, or pitching an AI or cloud solution to investors, this presentation template provides a professional, technology-focused visual framework ready to use right away.
Usage Points
-
Main Usage
Designed for presenting big data services, AI solutions, cloud platforms, or data analytics reports. The deep teal particle graphic design communicates technical expertise and a data-centric identity, making it ideal for professional IT and technology presentations.
-
How to Use
Download the PPTX file and open it in PowerPoint or a compatible application. Replace the placeholder text and figures in the diagram, chart, and map slides with your own data, then reorder slides to match your presentation flow. Colors and fonts are fully customizable.
-
Recommended For
Best suited for IT company planners, data analysts, AI development teams, and tech startup founders. Recommended for investor pitch sessions, internal data reporting, conference presentations, and any professional setting where technical credibility is essential.
-
Slide Structure
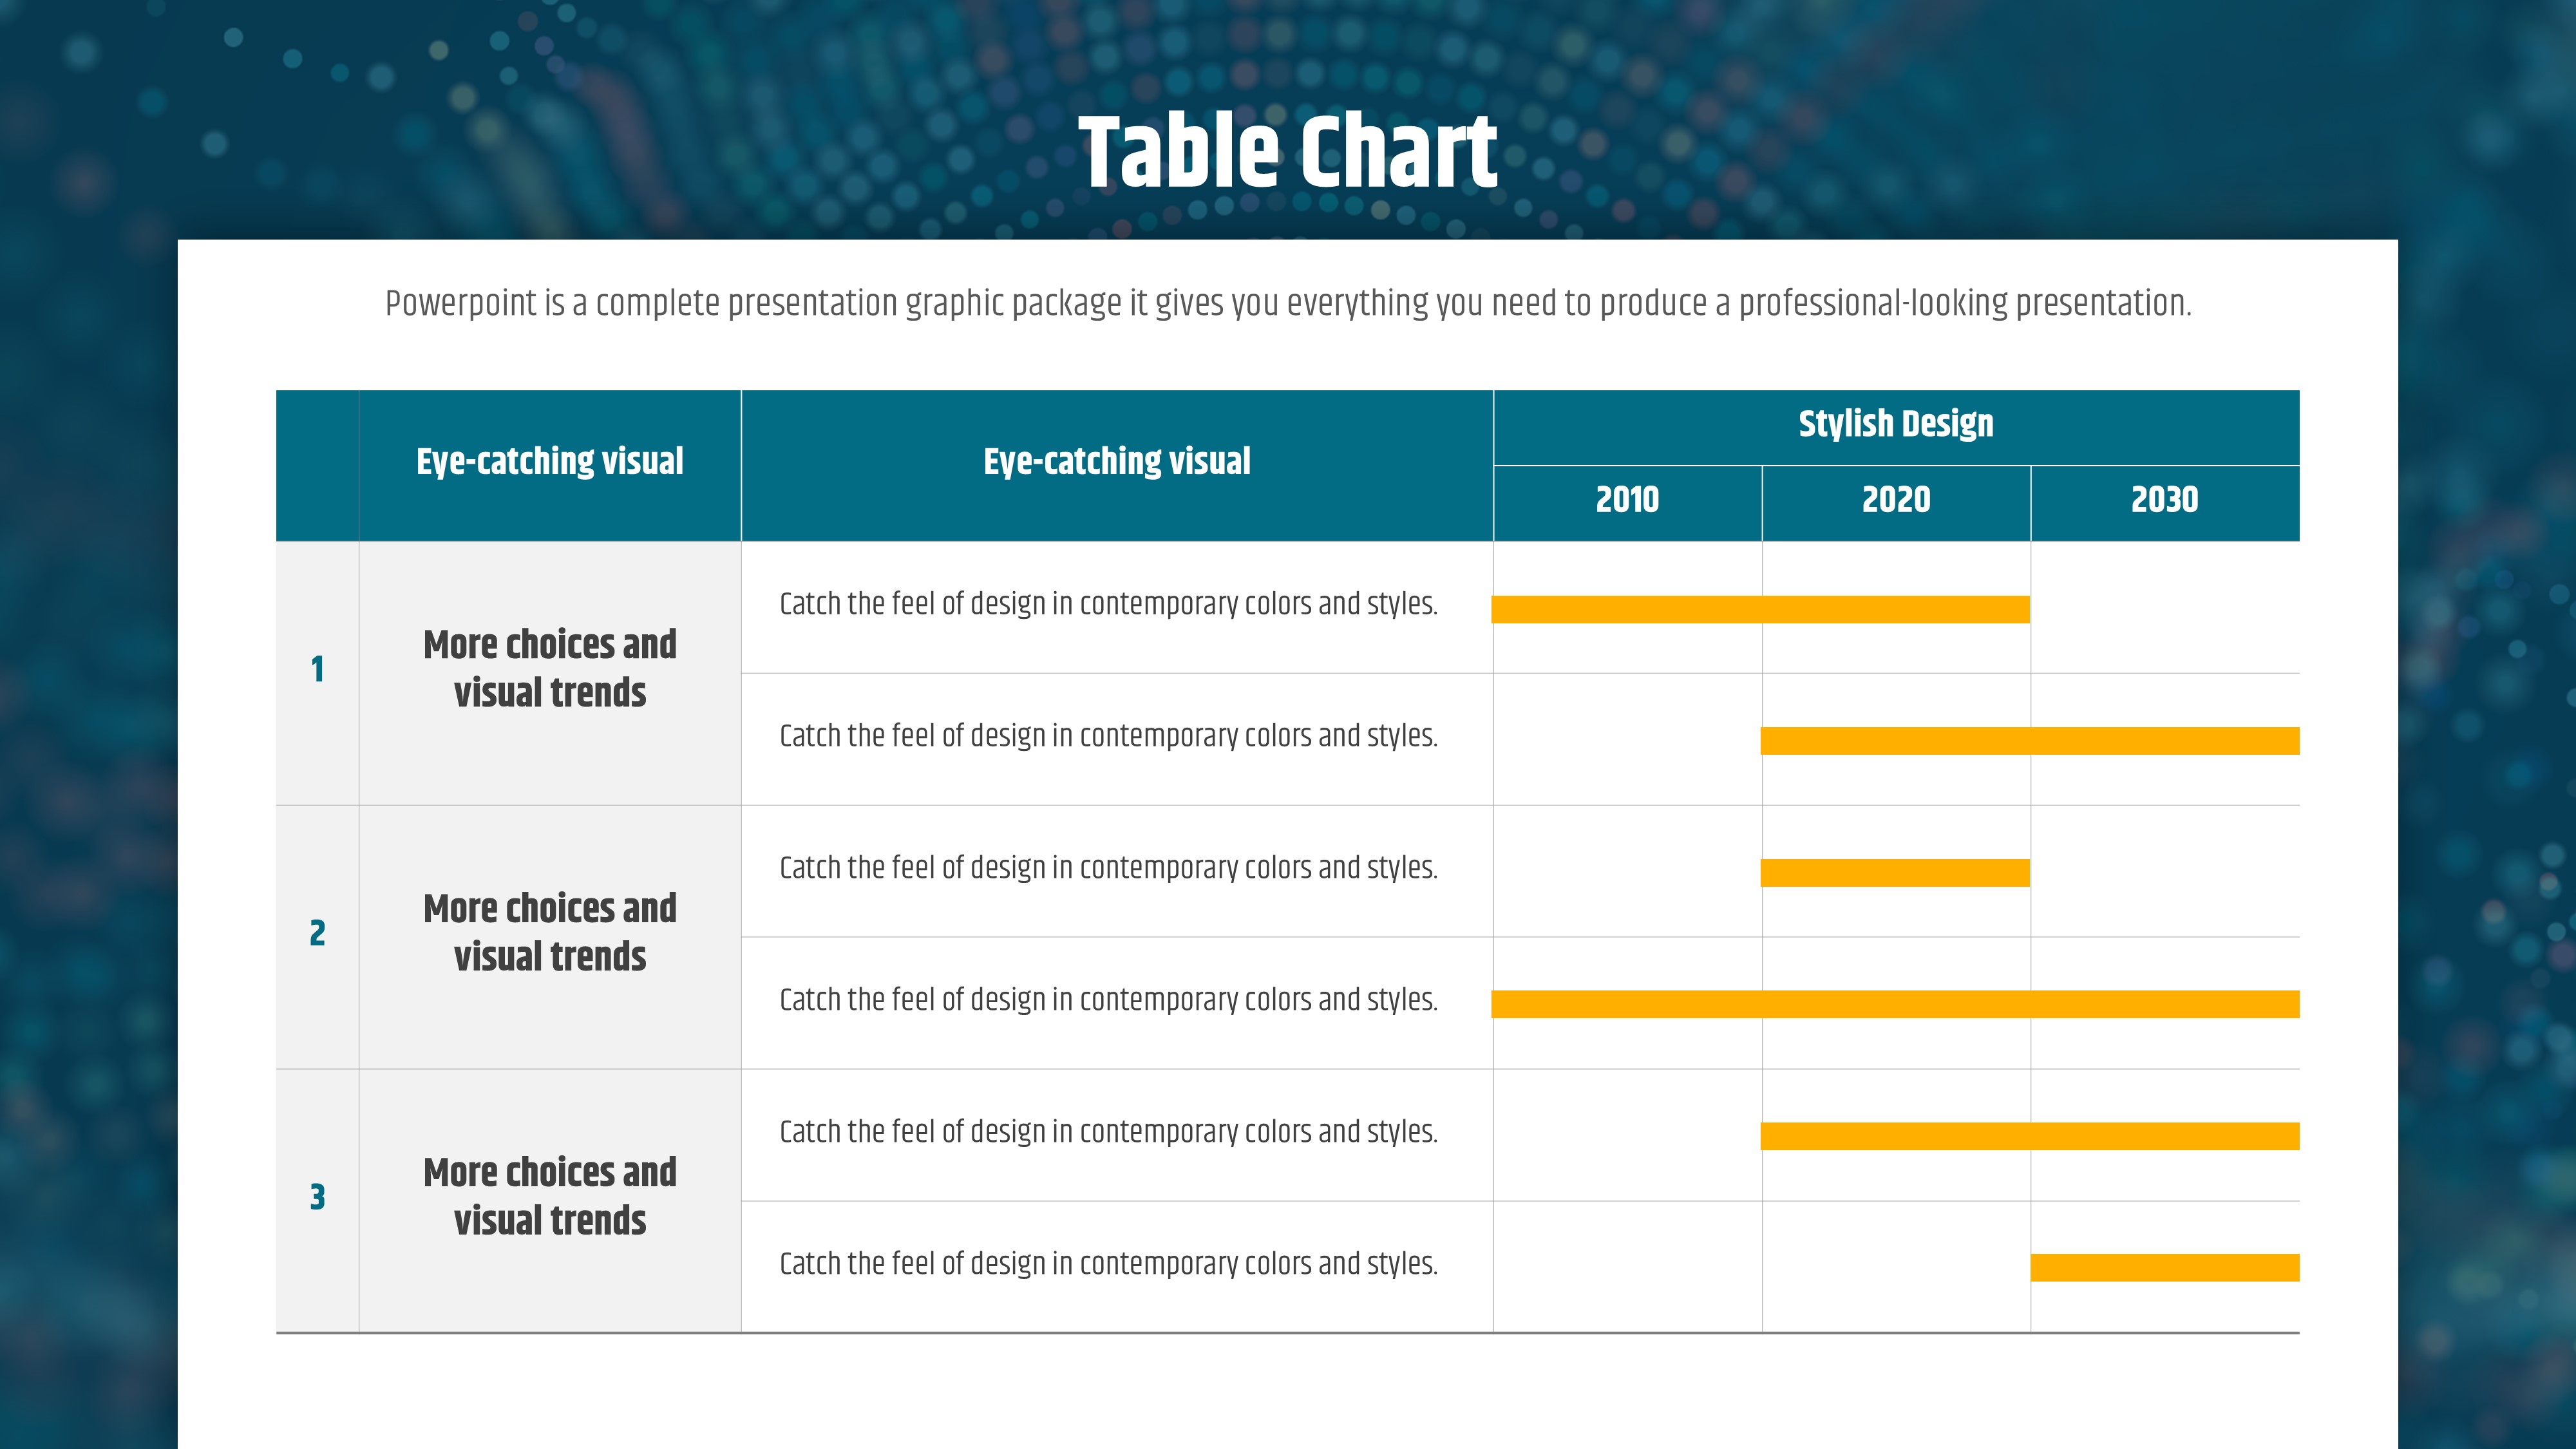
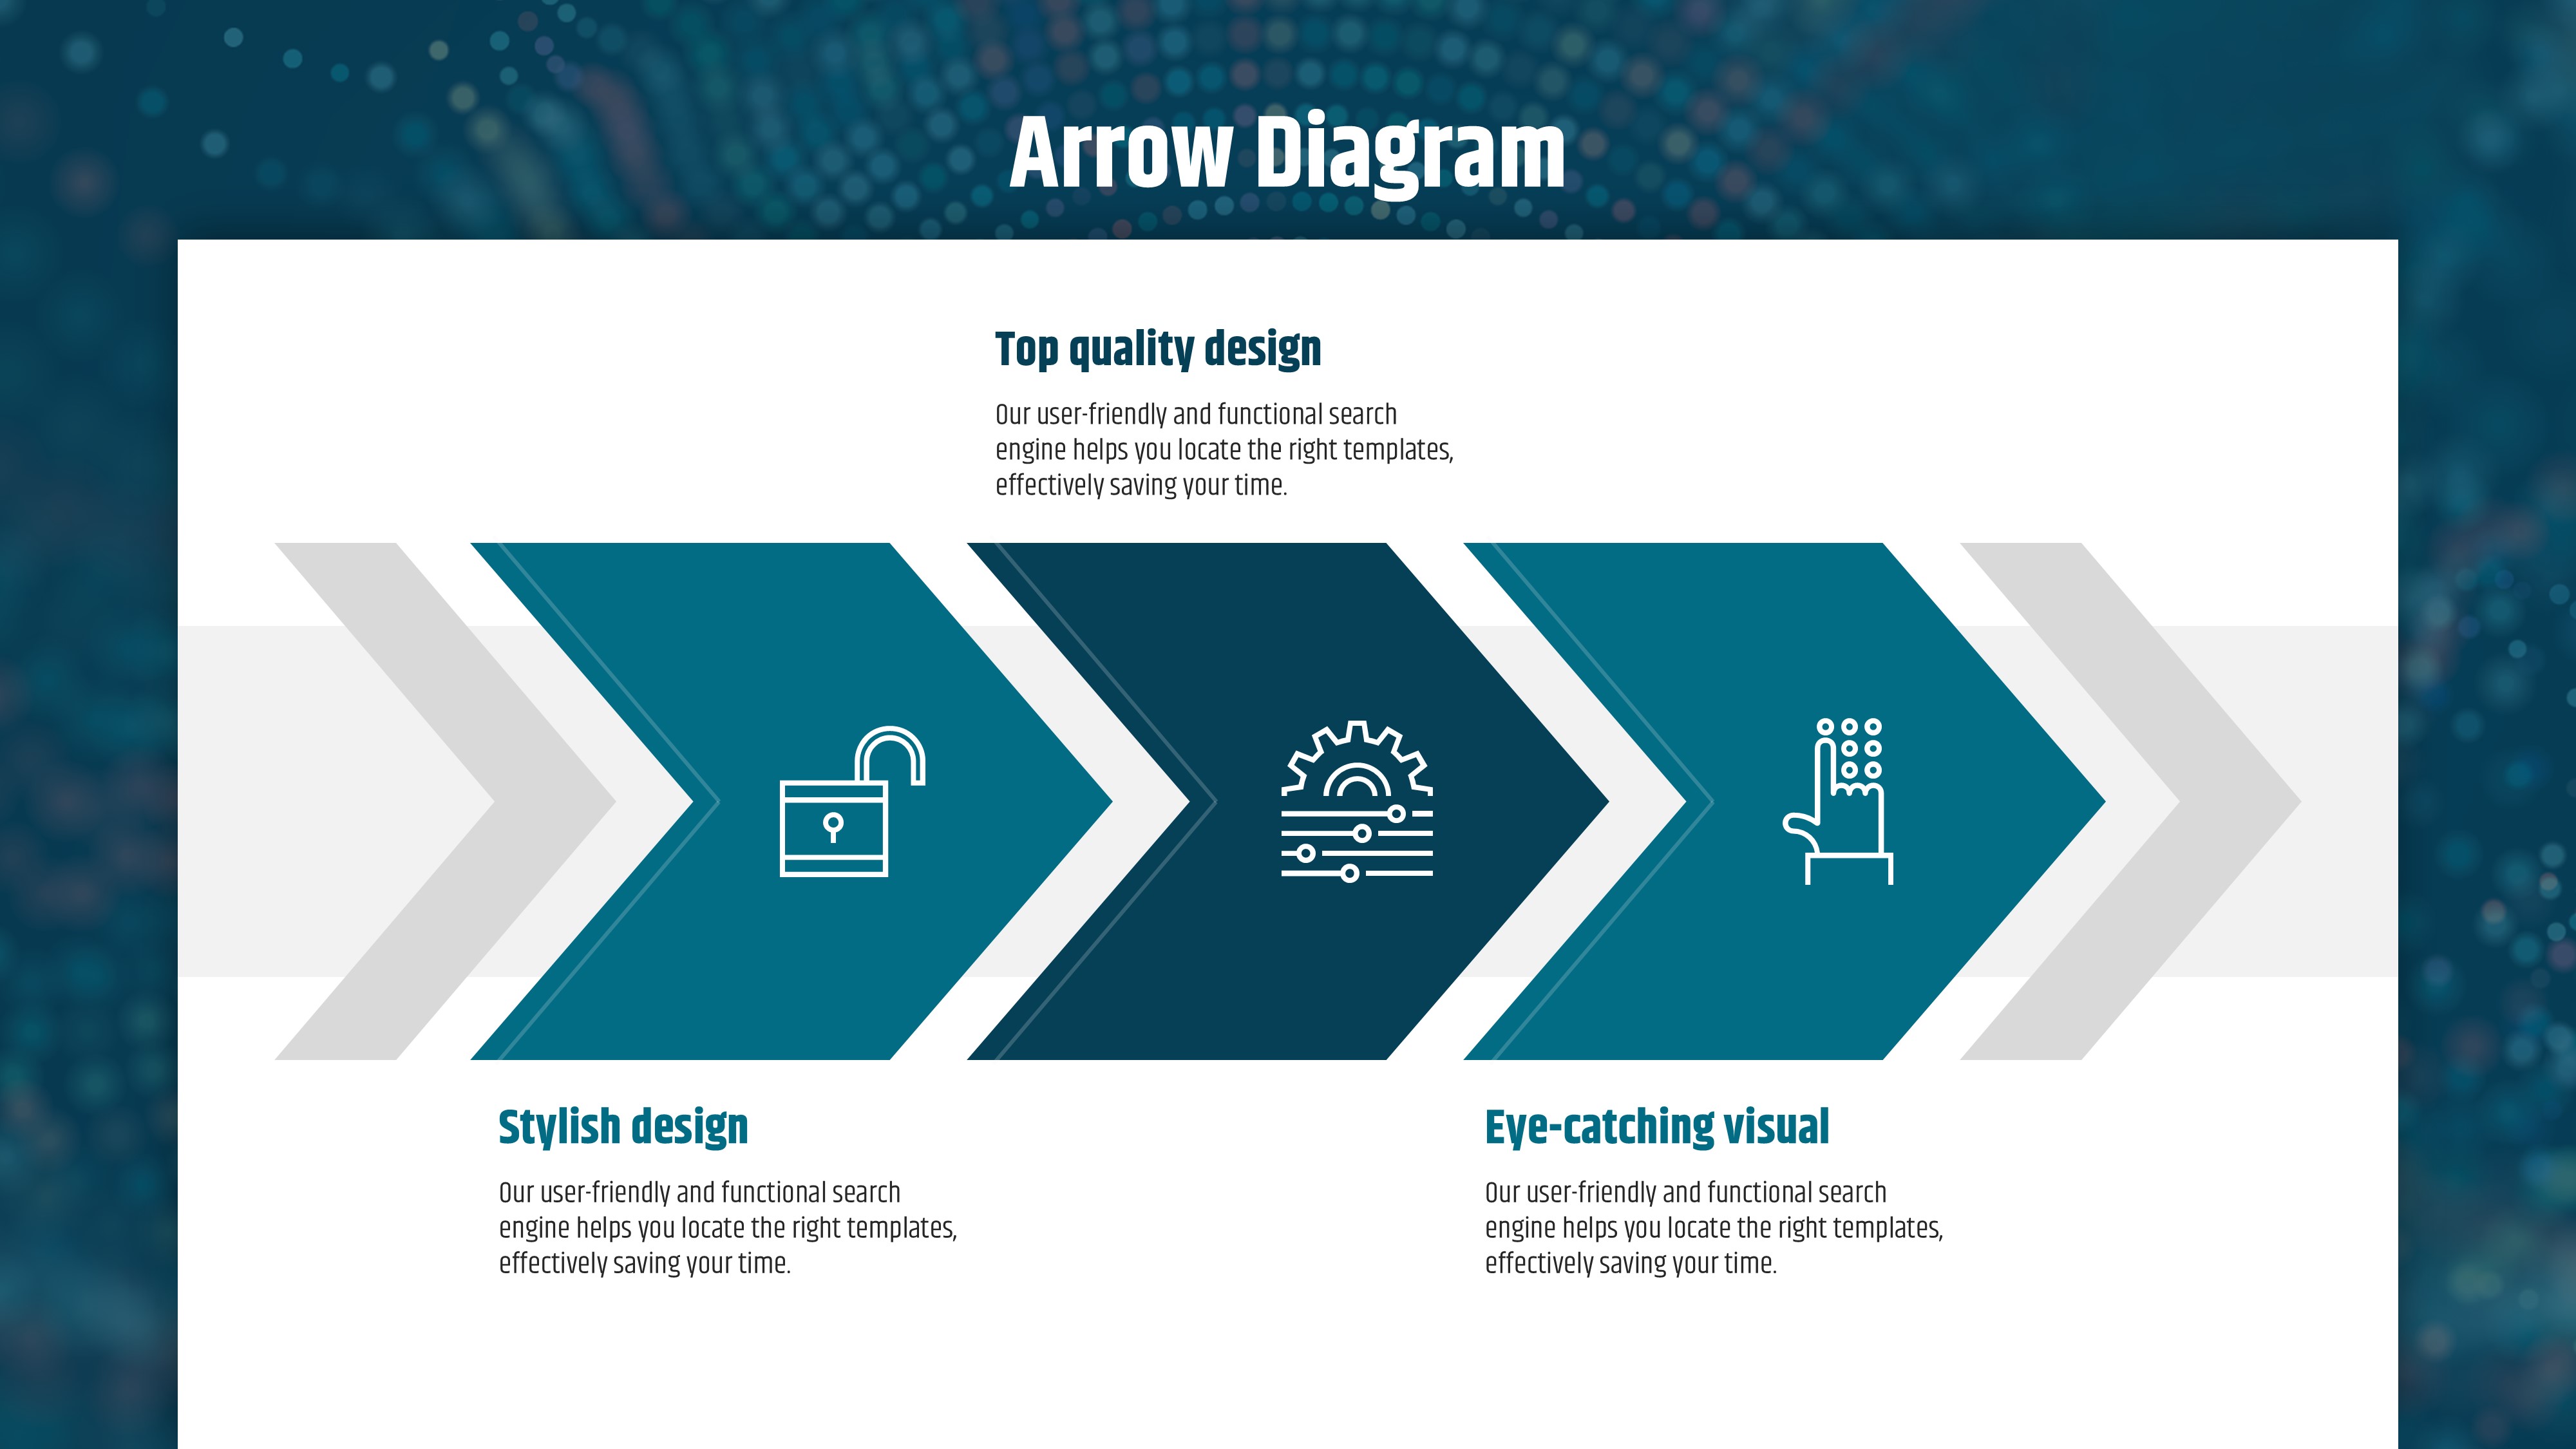
31 slides total: particle graphic title slide, converging and diverging hub diagrams, vertical bar and line combo chart, clustered column comparison chart, 2000–2030 step timeline diagram, and an Asia map slide with pin markers and supporting text blocks.


