Big Data System Domain Diagram – Business Overview and Infographic
RJ0400071_21
- Last Update 06/06/2025
- File Size 5.2MB
- # of Slides 2
- File Format PPTX
- Slide Ratio 16:9
- Color
Keywords
- #Content-Based Slides
- #Design-Based Slides
- #Company Introduction
- #Business Introduction
- #Diagram
- #Business Areas
- #Business Areas
- #Spread
- #Centralized Diagram
- #16:9
- #radial diagram PowerPoint
- #hub-and-spoke diagram slide
- #big data system architecture
- #4-node cluster diagram
- #business overview infographic
- #data visualization PowerPoint template
About the Product
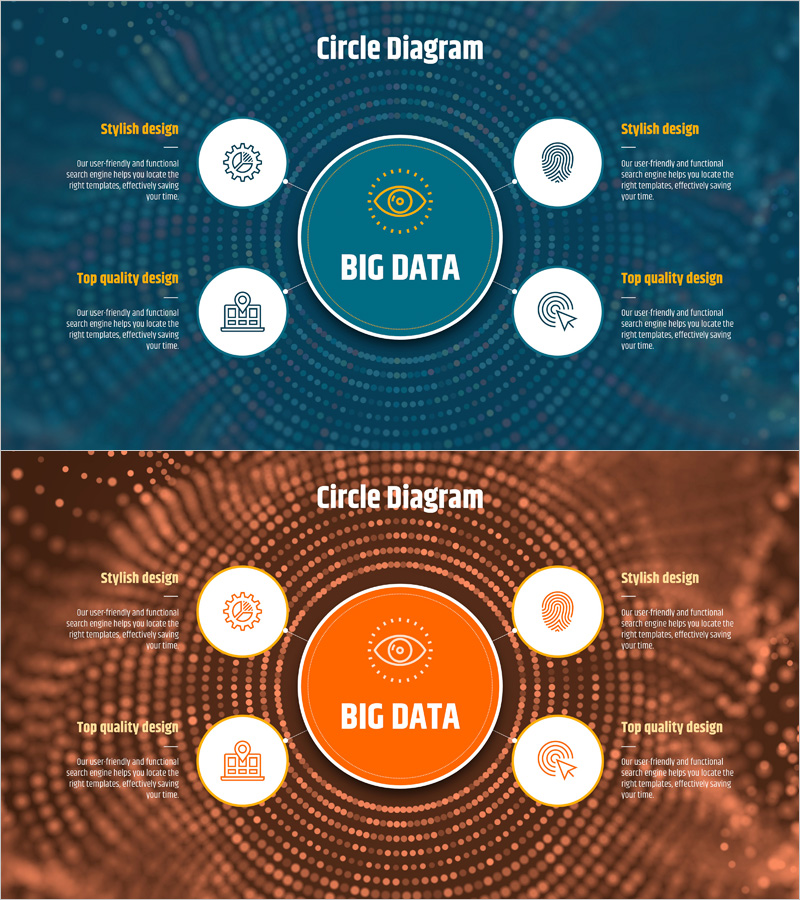
A radial diagram PowerPoint slide featuring a central concept surrounded by four nodes that expand information outward in a hub-and-spoke layout. Designed with a teal background, dot pattern, white circular nodes, and gold icons, this slide is optimized for data-driven business presentations and system architecture explanations. Each node includes an icon placeholder and text area, allowing you to represent complex concepts such as big data ecosystems, system domains, business frameworks, and organizational structures. The 2-slide set provides two color versions—teal tone and orange tone—so you can match your presentation's visual identity. Fully editable in PowerPoint format, enabling quick customization of text, icons, and colors.
Usage Points
-
Main Usage
Clearly illustrate complex system structures and business domains by showing the relationship between a central concept and four surrounding elements. Ideal for representing big data ecosystems, cloud architectures, organizational hierarchies, and business domains—helping audiences grasp multi-layered information visually.
-
How to Use
Enter your core concept (e.g., BIG DATA) in the central circular node, then place supporting elements (e.g., Technology, Security, Analytics, Applications) in the four surrounding nodes. Customize icons to match your content and edit text fields. Select the color version that aligns with your presentation's brand identity.
-
Recommended For
IT and technology companies presenting business overviews, data analytics teams explaining system architectures, consulting firms showcasing business models, startups pitching to investors, and educators illustrating complex concepts in lectures.
-
Slide Structure
A large central circular node (with text and icon input areas) is surrounded by four smaller circular nodes positioned at top, bottom, left, and right (each with icon and text input areas). Connection lines between nodes and a dot-pattern background create visual cohesion. Both slides share the same structure with different color schemes: teal tone and orange tone.
Related Products
-

Hexagonal Diffusion Diagram for Business Area Visualization
#Company Introduction #Business Introduction #Diagram
-

Business Value Diagram – Visualizing Business Sectors
#Company Introduction #Business Introduction #Diagram
-

Travel Business Services Area – Effective Diagram Design
#Company Introduction #Business Introduction #Diagram
-

Mobile Security Service Diagram
#Company Introduction #Business Introduction #Diagram
