Linear Diagram Visualizing Big Data Development Process
RJ0400071_12
- Last Update 06/06/2025
- File Size 6.1MB
- # of Slides 2
- File Format PPTX
- Slide Ratio 16:9
- Color
Keywords
- #Content-Based Slides
- #Design-Based Slides
- #Operational Plan
- #Marketing Plan and Strategy
- #Diagram
- #Business Processes
- #Marketing Strategy
- #Flow
- #Linear Flow
- #16:9
- #linear diagram PowerPoint
- #4-step process slide
- #PowerPoint flowchart
- #process diagram PowerPoint template
- #business process flow slide design
About the Product
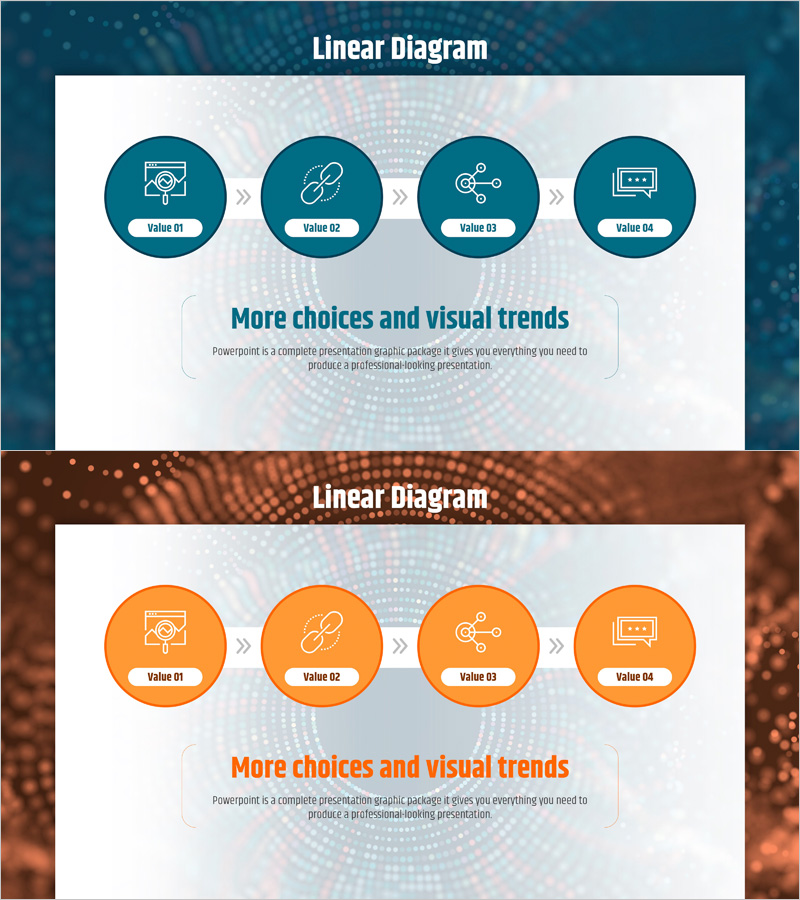
A linear diagram PowerPoint slide visualizing big data development process in 4 sequential steps. Available in two color schemes—dark blue and orange—with circular nodes featuring icons and labels connected by directional arrows. This slide design effectively communicates project phases, marketing campaign timelines, development workflows, and business process stages. The 16:9 widescreen format includes 2 fully editable slides ready for corporate presentations, strategy reports, and workflow documentation.
Usage Points
-
Main Usage
Visualize sequential business processes, project phases, marketing campaign timelines, and development workflows across 4 distinct steps. Icon-labeled nodes and clear arrow connections enhance audience comprehension of process flow and stage objectives.
-
How to Use
Replace node labels and icons with your specific process stage names. Select either the dark blue or orange color version to match your presentation's tone and corporate branding. Customize text and icons to reflect your workflow requirements.
-
Recommended For
IT and software development teams presenting technical roadmaps, marketing teams explaining campaign phase strategies, executive presentations of business implementation processes, and consulting firms demonstrating project methodologies.
-
Slide Structure
2-slide set featuring 4 circular nodes (dark blue or orange) arranged horizontally left-to-right with directional arrow connectors. Each node contains an icon and label ('Value 01–04'). A descriptive text area appears below the diagram for additional context or explanation.
Related Products
-

Real Estate Marketing System Diagram – Visualizing Strategic Flow
#Operational Plan #Marketing Plan and Strategy #Diagram
-

Startup Business Process - Efficient Operations and Strategies
#Operational Plan #Marketing Plan and Strategy #Diagram
-

Financial Services Business Processes – Step-by-Step Strategy
#Business Strategy #Operational Plan #Diagram
-

Business Process Steps – Planning and Execution
#Business Vision and Strategy #Operational Plan #Diagram
