Business Promotion Schedule Diagram – A Stepwise Approach to Success
RJ0400071_22
- Last Update 06/07/2025
- File Size 5.2MB
- # of Slides 2
- File Format PPTX
- Slide Ratio 16:9
- Color
Keywords
- #Content-Based Slides
- #Design-Based Slides
- #Company Introduction
- #Operational Plan
- #Diagram
- #History
- #Project Implementation Schedule
- #Flow
- #Cluster
- #Linear Flow
- #Closed Cluster Diagram
- #16:9
- #4-stage timeline diagram PowerPoint
- #linear timeline slide template
- #business schedule PowerPoint
- #milestone timeline presentation
- #PowerPoint diagram slide design
About the Product
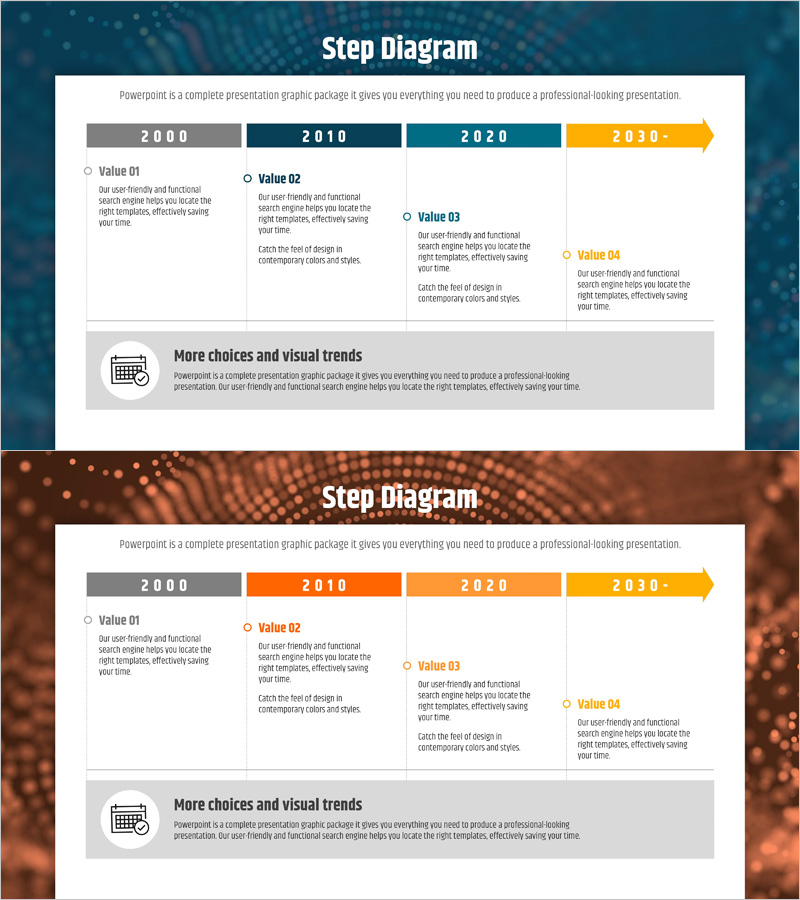
A professional PowerPoint slide featuring a 4-stage linear timeline diagram spanning from 2000 to 2030, designed to visualize business promotion schedules and strategic milestones. Each stage is clearly labeled with distinct values (Value 01 through 04), supported by descriptive text areas for detailed information input. The color palette combines gray, navy blue, orange, and yellow to create visual contrast and guide the viewer through the timeline progression. The final stage is represented as an arrow, emphasizing future direction and momentum. This diagram slide is immediately ready for use in operational plans, business strategy presentations, and milestone announcements.
Usage Points
-
Main Usage
Effectively communicate business promotion timelines, project milestones, and long-term strategic roadmaps by breaking them into distinct stages aligned with specific time periods. The color-differentiated stages help audiences quickly grasp the progression of business objectives and anticipated outcomes at each phase.
-
How to Use
Enter years or time periods in each stage box and add corresponding goals, achievements, or implementation details in the text areas below. Colors can be retained or customized to match corporate branding. The number of nodes can be adjusted to fit your project scope by duplicating or removing stages as needed.
-
Recommended For
Ideal for executive presentations on business planning, investor relations (IR) materials, organizational strategy alignment meetings, consulting reports, and marketing planning documents requiring timeline visualization. Particularly effective when demonstrating phased progress and sequential business development.
-
Slide Structure
2-slide set. Slide 1 features a navy blue background with 4 nodes (2000, 2010, 2020, 2030→) forming a linear timeline, each with descriptive text areas for Values 01–04. Slide 2 provides the same structure with an orange-toned background, offering color variation options for presentation flexibility.
Related Products
-

Yearly Plan Arrow Diagram – Quality Assurance Plans
#Company Introduction #Business Management #Diagram
-

Molecular Graphics History – Business Vision and Goals
#Company Introduction #Business Vision and Strategy #Diagram
-

Security Service Business Promotion Schedule – Technical Sector
#Product/Service Introduction #Operational Plan #Technical Approach
-

Company History Introduction Slide – Flow and Cluster
#Company Introduction #Diagram #History
