Big Data Development Plan by Year Slide
RJ0400071_7
- Last Update 06/07/2025
- File Size 5.2MB
- # of Slides 2
- File Format PPTX
- Slide Ratio 16:9
- Color
Keywords
About the Product
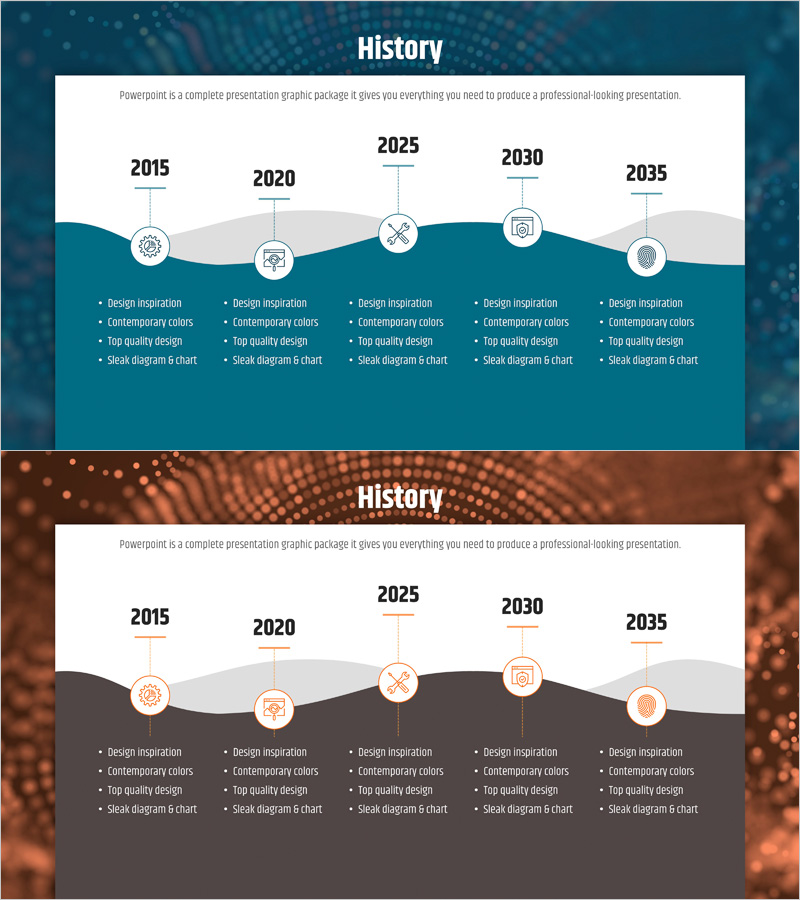
A timeline diagram PowerPoint slide that visualizes business progress across five key years from 2015 to 2035. The design features a wave-shaped curve connecting five circular nodes, each with an icon and bullet-point descriptions below. The color palette uses teal and gray tones to create a professional, data-driven appearance. Two slide variations are included: one with a teal background and one with a brown background, allowing you to match your presentation's overall tone. This slide deck is ideal for development plans, strategic roadmaps, annual progress reports, and organizational growth narratives where chronological progression and milestone achievement need clear visual representation.
Usage Points
-
Main Usage
This slide is optimized for visualizing business milestones, progress stages, and achievements across a defined time period. The wave-shaped curve connecting five nodes creates a sense of continuous progression and phased development, making it easy for audiences to understand the journey from start to finish. Icons and bullet points at each stage reinforce key messages.
-
How to Use
Use this slide in business strategy presentations, annual planning reports, product development roadmaps, and organizational growth narratives. Edit the year labels and bullet-point text by clicking on each node. Select between the teal or brown background version to match your presentation theme. Modify colors and fonts globally using the slide master for consistency across your deck.
-
Recommended For
Executives, business managers, project managers, marketing strategists, and R&D directors presenting business plans, development timelines, and strategic initiatives. Suitable for startup growth stage presentations, corporate long-term strategy announcements, and investor pitch decks where demonstrating progress over time is critical.
-
Slide Structure
Two-slide set with identical timeline structure. Five circular nodes (2015, 2020, 2025, 2030, 2035) are connected by a wave-shaped curve. Each node includes an icon and 3–4 bullet-point descriptions positioned below. First slide features a teal background; second slide uses a brown background for color variation and flexibility.
Related Products
-

Alphabet Theme History Connection Diagram
#Company Introduction #Business Management #Diagram
-

Timeline of Environmental Initiatives
#Company Introduction #Business Management #Diagram
-

Architectural History Roadmap – Development Through Clusters and Connections
#Company Introduction #Business Management #Diagram
-

History Speech Bubble Diagram - Visual Timeline Representation
#Company Introduction #Business Management #Diagram
