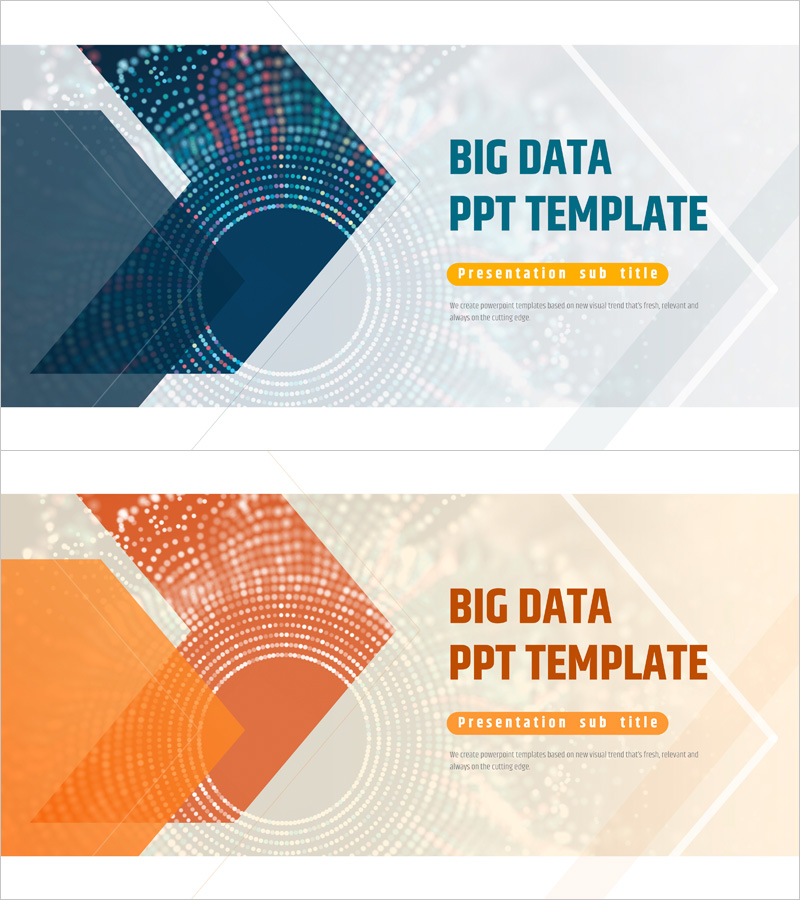
Big Data Analysis Template Cover - The Fusion of Data and Insights
RJ0400071
- Last Update 06/06/2025
- File Size 11.2MB
- # of Slides 2
- File Format PPTX
- Slide Ratio 16:9
- Color
Keywords
About the Product
A professional cover slide set designed for big data analysis presentations. Featuring a dark blue background with data visualization elements that effectively communicate technical credibility and analytical expertise. The 2-slide set includes a main cover and subtitle slide, optimized for 16:9 widescreen format in modern presentation environments. Fully editable in PowerPoint PPTX format, suitable for data analysis reports, technology seminars, business insights presentations, and executive briefings. The balanced layout combining geometric patterns on the left with data visualization elements on the right creates strong visual impact and professional appeal.
Usage Points
-
Main Usage
Establishes a strong first impression for data-driven and technology-focused presentations. The dark blue data visualization elements visually communicate analytical capability and technical expertise, effectively capturing audience attention from the opening moment.
-
How to Use
Use as the opening cover slide to highlight your organization's data analysis capabilities. Input presentation title and subtitle in designated text areas, and place company logo in the designated space to maintain brand consistency. Particularly effective for presentations emphasizing data-driven decision-making and analytical insights.
-
Recommended For
Ideal for data analysts, business intelligence professionals, technology strategists, marketing analysts, and research teams presenting analysis results, market insights, technology seminars, investor pitches, and executive reports. Suitable for C-level briefings and stakeholder communications.
-
Slide Structure
2-slide composition featuring a main cover slide and subtitle slide. Each slide includes one title input area, one subtitle input area, and logo placement space. The two-column layout separates geometric patterns on the left from data visualization elements on the right, creating clear visual hierarchy and information organization.


