Big Data Development Schedule to Formulate Business Strategy
RJ0400071_8
- Last Update 06/07/2025
- File Size 5.2MB
- # of Slides 2
- File Format PPTX
- Slide Ratio 16:9
- Color
Keywords
- #Content-Based Slides
- #Design-Based Slides
- #Business Strategy
- #Operational Plan
- #Diagram
- #Roadmap
- #Project Implementation Schedule
- #Cluster
- #Table
- #Closed Cluster Diagram
- #16:9
- #Gantt chart PowerPoint
- #project schedule slide template
- #timeline diagram presentation
- #business roadmap PPT
- #project management slide download
About the Product
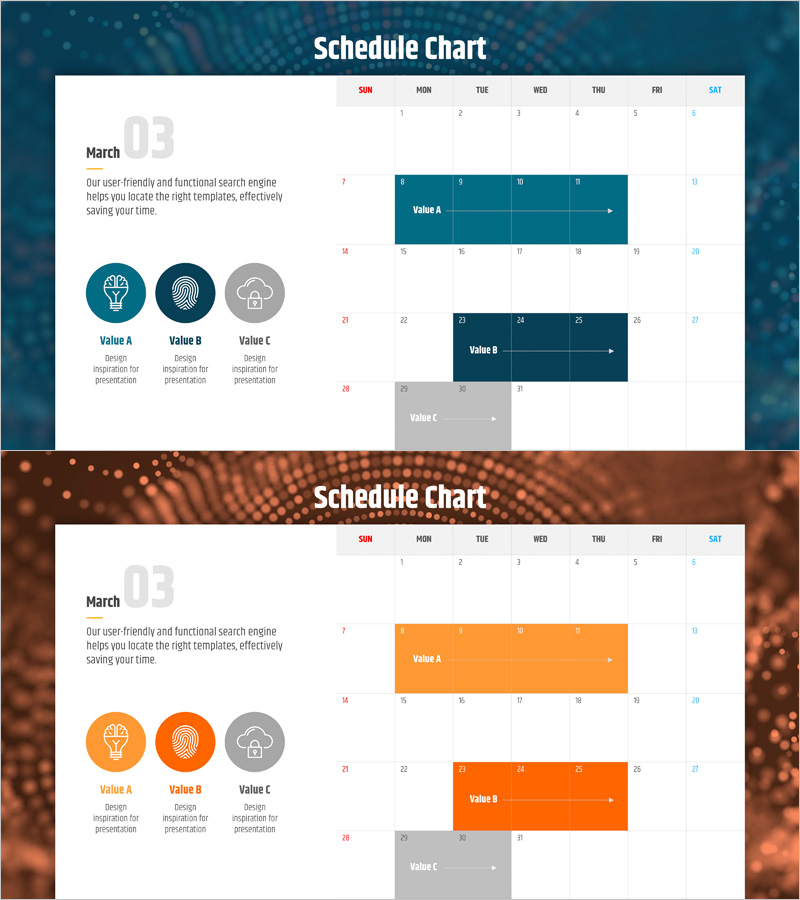
A Gantt chart PowerPoint slide designed for project schedule management and business strategy formulation. This presentation template visualizes three independent project timelines on a monthly basis, with each project distinguished by color for quick status overview. The slide deck is ideal for development schedules, operational planning, and roadmap presentations across various business scenarios. Formatted in 16:9 widescreen with 2 slides ready for immediate editing and customization.
Usage Points
-
Main Usage
This Gantt chart slide enables visual representation of project schedules and business strategy execution. When managing multiple concurrent projects, it clearly communicates start dates, end dates, and project duration to stakeholders. Suitable for executive reporting, team meetings, and investor presentations to demonstrate scheduling and project management capability.
-
How to Use
Enter project names and timelines in the monthly grid cells to build your schedule. Adjust the colored project bars by dragging to modify duration, add additional projects, or extend the month range as needed. Customize text labels and colors to match your presentation context and organizational branding.
-
Recommended For
IT development teams, project managers, business planners, operations managers, and consultants use this template for schedule tracking and progress reporting. Applications include software development roadmaps, marketing campaign timelines, construction project schedules, organizational restructuring plans, and cross-functional initiative tracking.
-
Slide Structure
2-slide template featuring a monthly calendar header (Sun–Sat) with 3 horizontal project bars (Value A, B, C) per slide. Each project bar displays as a colored block spanning from start to end date. Left side includes month labels and 3 value items with icons and descriptions. Two color scheme versions provided: dark teal and orange backgrounds.
Related Products
-

Operational Schedule Roadmap – Effective Business Promotion Strategy
#Business Strategy #Operational Plan #Diagram
-

Business Idea Service Roadmap – Business Strategy
#Business Strategy #Operational Plan #Diagram
-

August, September, October Calendar Diagram – Essential for Business Strategy
#Business Strategy #Operational Plan #Diagram
-

Big Data Analysis Schedule – Visualizing Business Strategy
#Business Strategy #Operational Plan #Diagram
