Competitor Analysis Chart – Visualizing Market and Competitive Advantage
RJ0400071_20
- Last Update 06/06/2025
- File Size 5.2MB
- # of Slides 2
- File Format PPTX
- Slide Ratio 16:9
- Color
Keywords
- #Content-Based Slides
- #Design-Based Slides
- #Market and Competitor Analysis
- #Diagram
- #Graph
- #Competitor Analysis
- #Competitive Advantage
- #Table
- #16:9
- #line chart PowerPoint slide
- #line graph presentation template
- #time series data visualization
- #competitor analysis chart PPT
- #trend comparison PowerPoint
About the Product
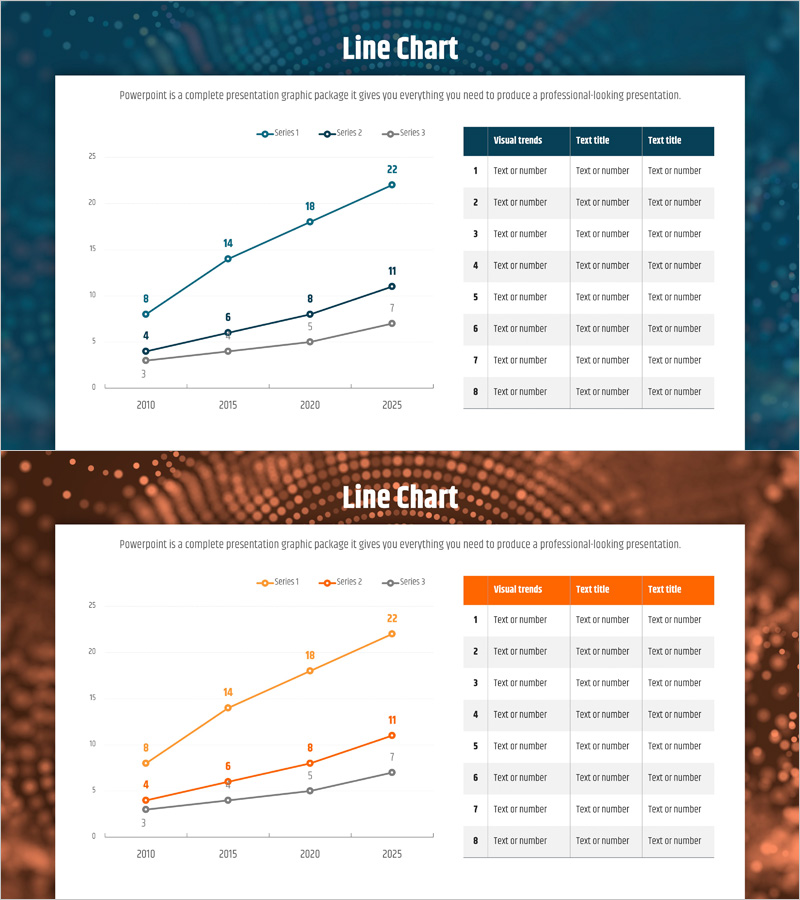
A professional line chart PowerPoint slide optimized for market analysis and competitive comparison. The slide features a dark blue background with three distinct data series displayed across a timeline from 2010 to 2025, accompanied by a data table on the right side. Each line is color-coded for easy differentiation, with clear numerical data points marked at each interval. Ideal for business presentations, quarterly reports, marketing plans, and strategic analyses where you need to visualize growth trends, market share evolution, or competitor performance. The slide includes editable text areas, legend, and data table that can be customized for various industries and datasets.
Usage Points
-
Main Usage
Visualize and compare multiple data series over time on a single slide. Effectively communicate competitive positioning, market share trends, revenue growth, customer satisfaction changes, and other multi-series metrics to stakeholders and decision-makers.
-
How to Use
Replace each line series with your own data values and update the data table with corresponding numbers. Modify the legend labels and axis titles to match your presentation context. Insert into business reports, investor presentations, marketing strategy decks, or quarterly performance reviews.
-
Recommended For
Executive presentations, investor relations materials, marketing team market analysis, sales competitive intelligence briefings, consulting firm strategy proposals, and finance team performance trend analysis.
-
Slide Structure
Left-aligned line chart area with 3 color-coded series, 4 data points per series, and integrated legend. Right-aligned data table with 8 rows and 3 columns for detailed numerical reference. Title area at top and description text space at bottom. Formatted in 16:9 widescreen for modern presentation environments.
Related Products
-

Benchmarking with Bar Chart Comparison
#Market and Competitor Analysis #Diagram #Graph
-

Visualizing Market Analysis with Line Chart – Harmony of Mint and Orange
#Market and Competitor Analysis #Diagram #Graph
-

Competitiveness Table and Chart Analysis – Market and Competitor Analysis
#Market and Competitor Analysis #Diagram #Graph
-

Comparison Graph of Yearly Trends – Market and Competitor Analysis
#Market and Competitor Analysis #Diagram #Graph
