Big Data Development Status Analysis Graph – Visualizing Business Strategy
RJ0400071_6
- Last Update 06/07/2025
- File Size 5.2MB
- # of Slides 2
- File Format PPTX
- Slide Ratio 16:9
- Color
Keywords
- #Content-Based Slides
- #Design-Based Slides
- #Product/Service Introduction
- #Business Introduction
- #Diagram
- #Graph
- #Development Status
- #Technological Status
- #Table
- #Circles
- #Standard Table
- #Doughnut Chart
- #16:9
- #doughnut chart PowerPoint
- #pie chart slide template
- #data ratio visualization
- #circular graph presentation
- #business analysis chart template download
About the Product
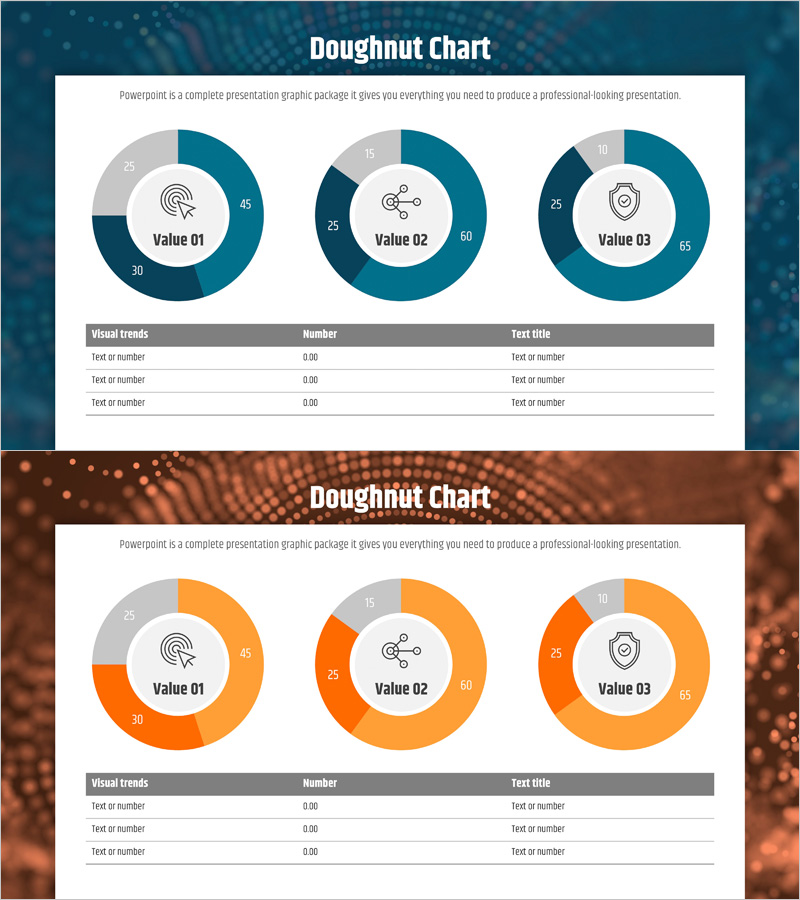
A professional PowerPoint slide featuring three doughnut charts for comparing complex data at a glance. Each chart uses a three-tone color scheme with dark blue, light gray, and mid-tone segments, with icons and text centered in the ring area to highlight category-specific information. The data table below allows you to organize numerical values, making it immediately applicable to presentations, reports, and analytical materials. Composed of 2 slides in 16:9 widescreen format, all elements are fully editable in PPTX format for seamless customization.
Usage Points
-
Main Usage
Optimized for comparing multiple data items by ratio, composition, and distribution. Each doughnut chart represents an independent dataset, with centered icons clearly distinguishing categories. Ideal for business analysis, market status, development progress, customer segmentation, and other ratio-based data visualization needs.
-
How to Use
Select color segments in each doughnut chart and input values to automatically reflect proportions. Edit the centered icon and text to change category names, then add specific figures and descriptions to the data table below. Customize the color palette to match your company brand colors for a unified presentation.
-
Recommended For
Recommended for executive reports, quarterly performance analysis, market research presentations, product development status updates, customer segmentation analysis, and budget allocation reports. Ideal for finance, marketing, strategy, and R&D teams requiring data-driven decision-making presentations.
-
Slide Structure
Layout includes title area at top, three doughnut charts arranged horizontally (left, center, right), icon and text input areas centered in each ring, and a three-row data table at bottom. Each doughnut is segmented into 4–5 color sections with numerical labels displayed externally. Two slide variations provided in dark blue and orange color schemes.
Related Products
-

Space Industry Development Status Graph – Capturing the Future of Industry
#Product/Service Introduction #Business Introduction #Graph
-

Exercise Objectives Achieved Diagram & Chart – Post-Progress
#Product/Service Introduction #Business Introduction #Diagram
-

Development Status Analysis Chart - Visualization for Effective Market Analysis
#Product/Service Introduction #Market and Competitor Analysis #Diagram
-

Business Development Status Donut Graph – A Template for Visual Communication
#Product/Service Introduction #Business Introduction #Diagram
