Data Security Presentation Template – Trustworthy Design with Visual Appeal
J0400056
- Last Update 07/31/2025
- File Size 15.4MB
- # of Slides 21
- File Format PPTX
- Slide Ratio 16:9
- Color
Slide Preview


Keywords
About the Product
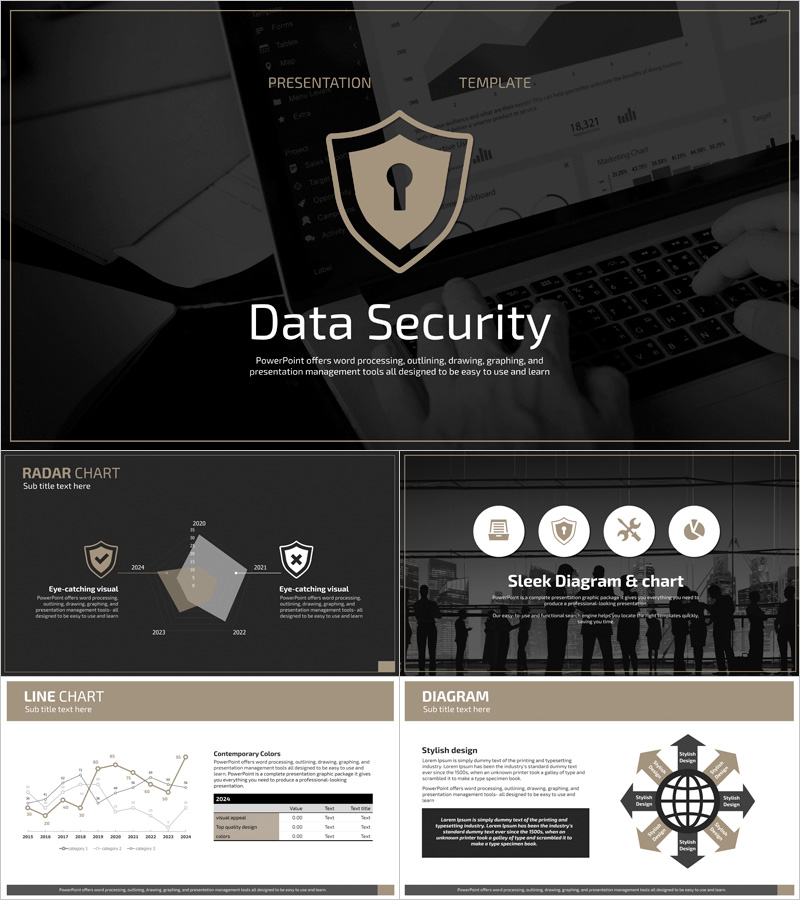
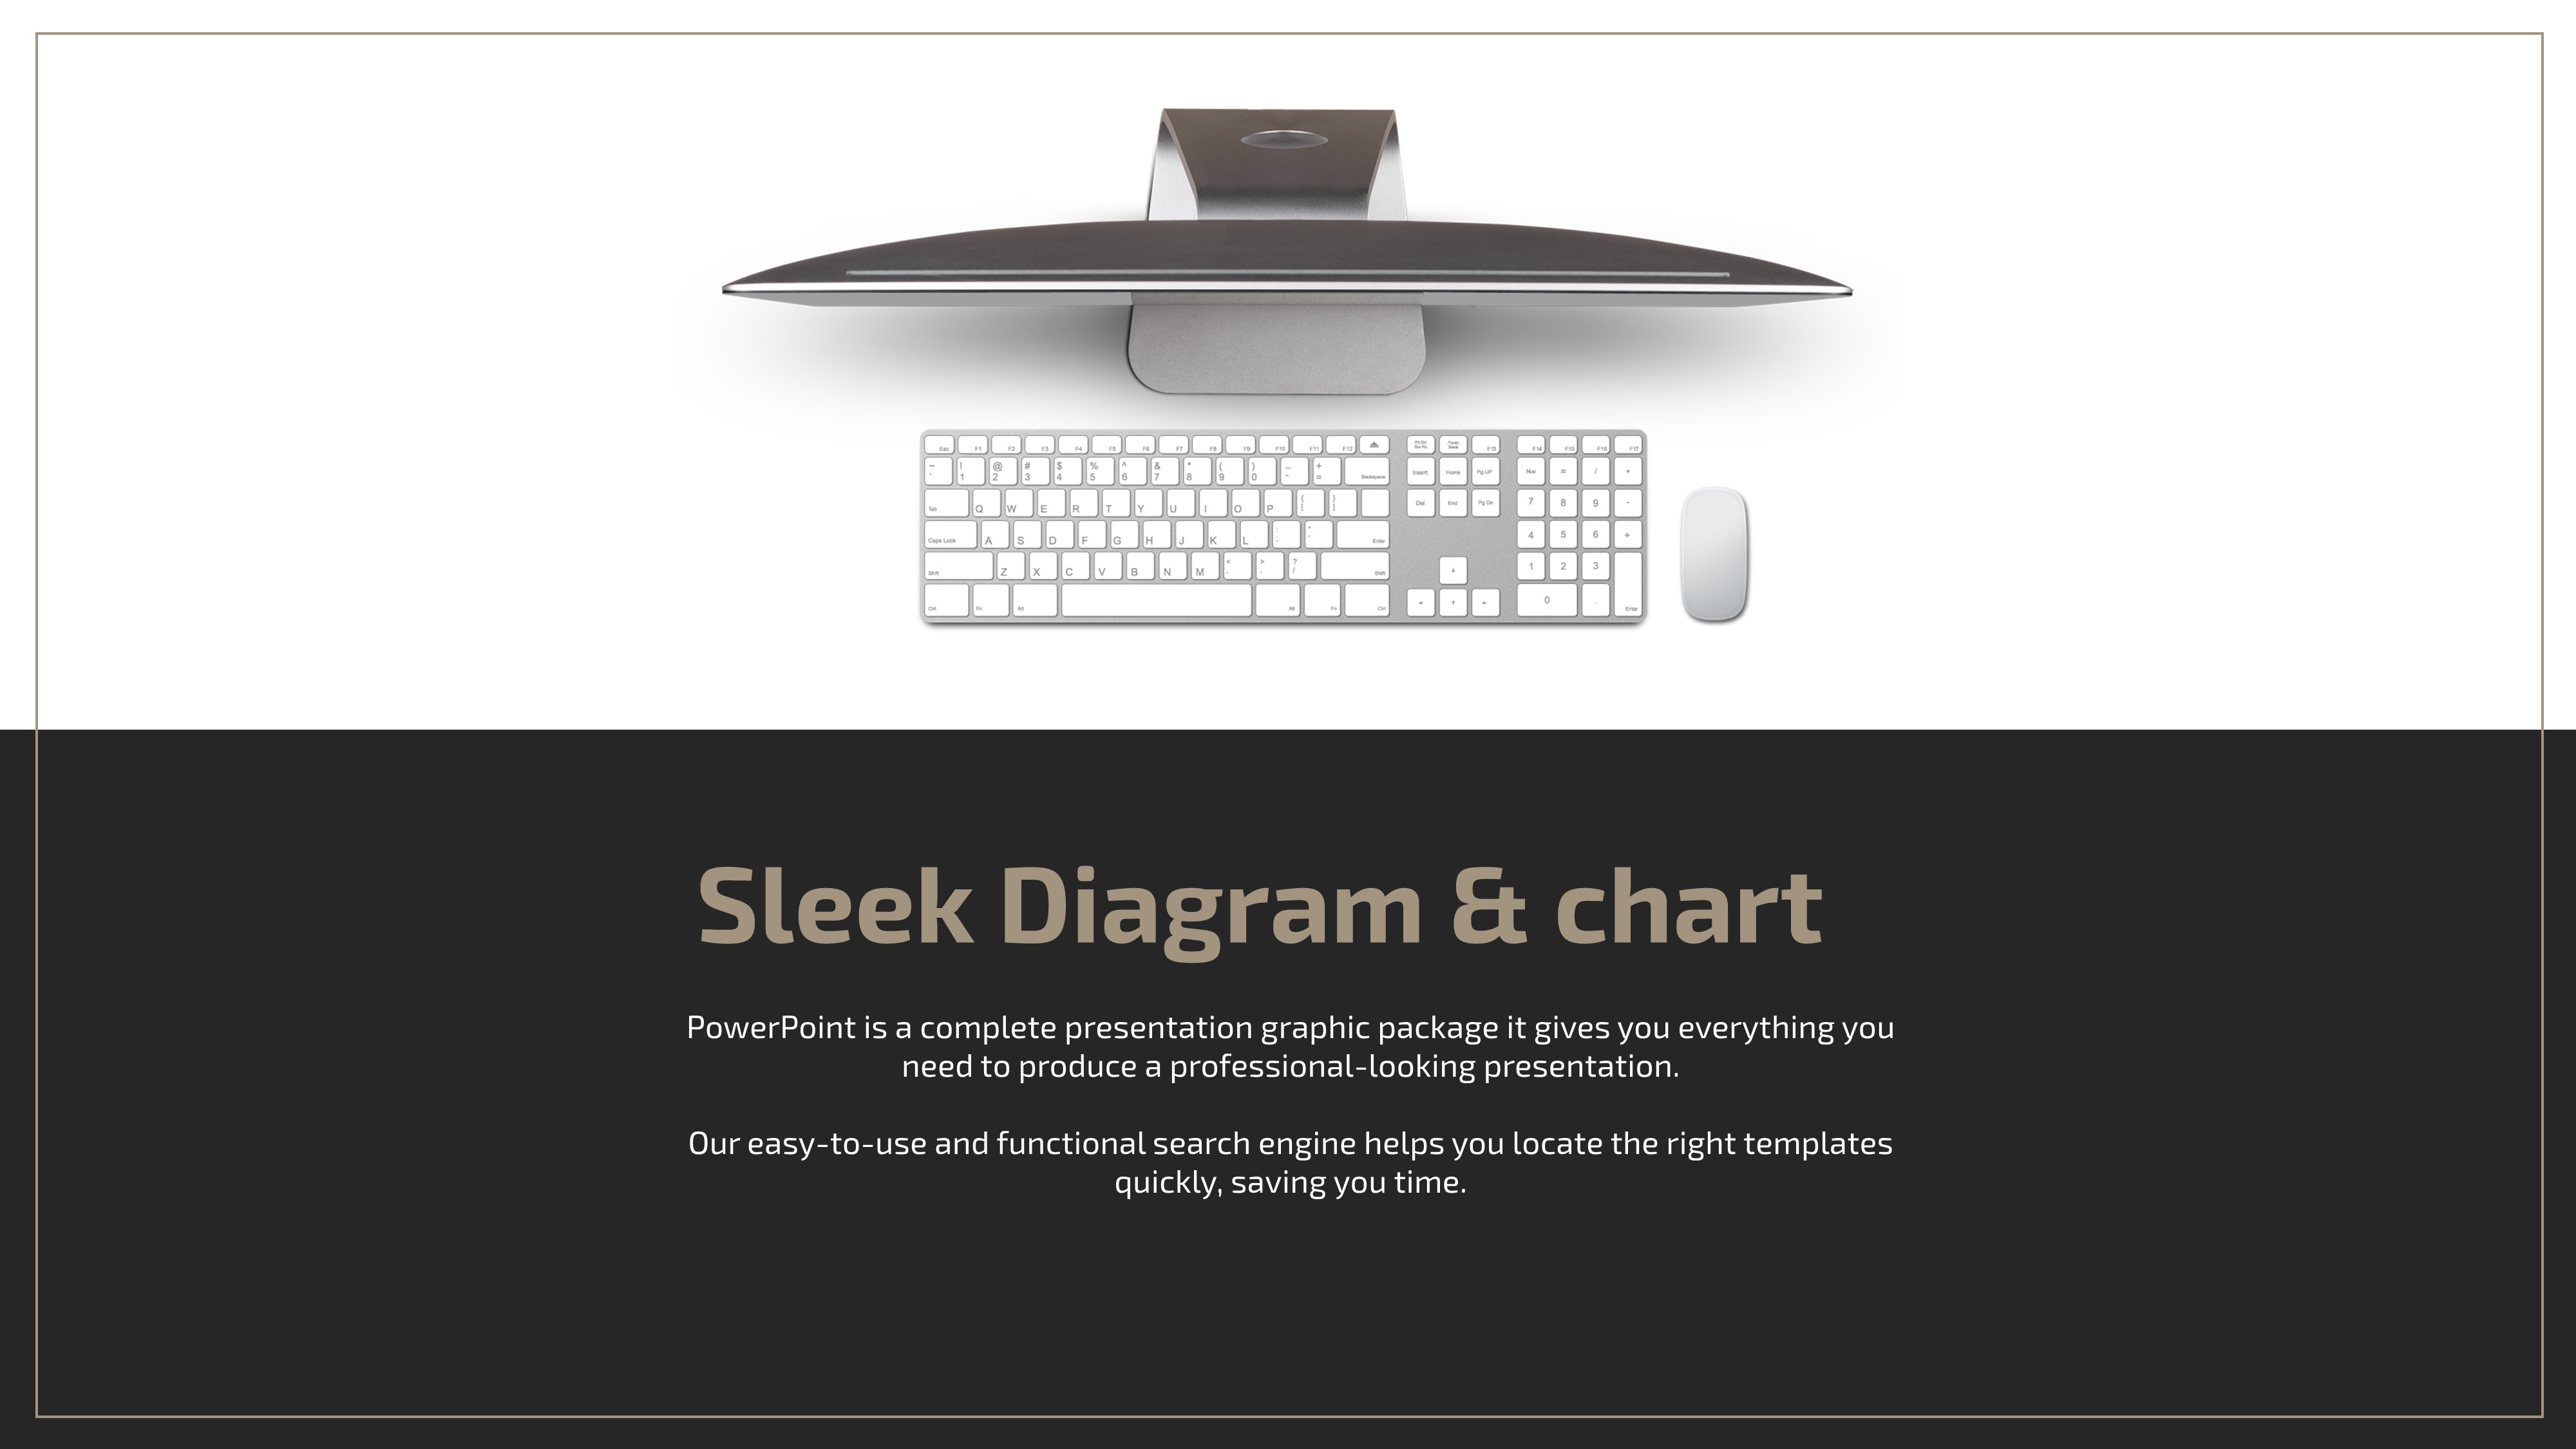
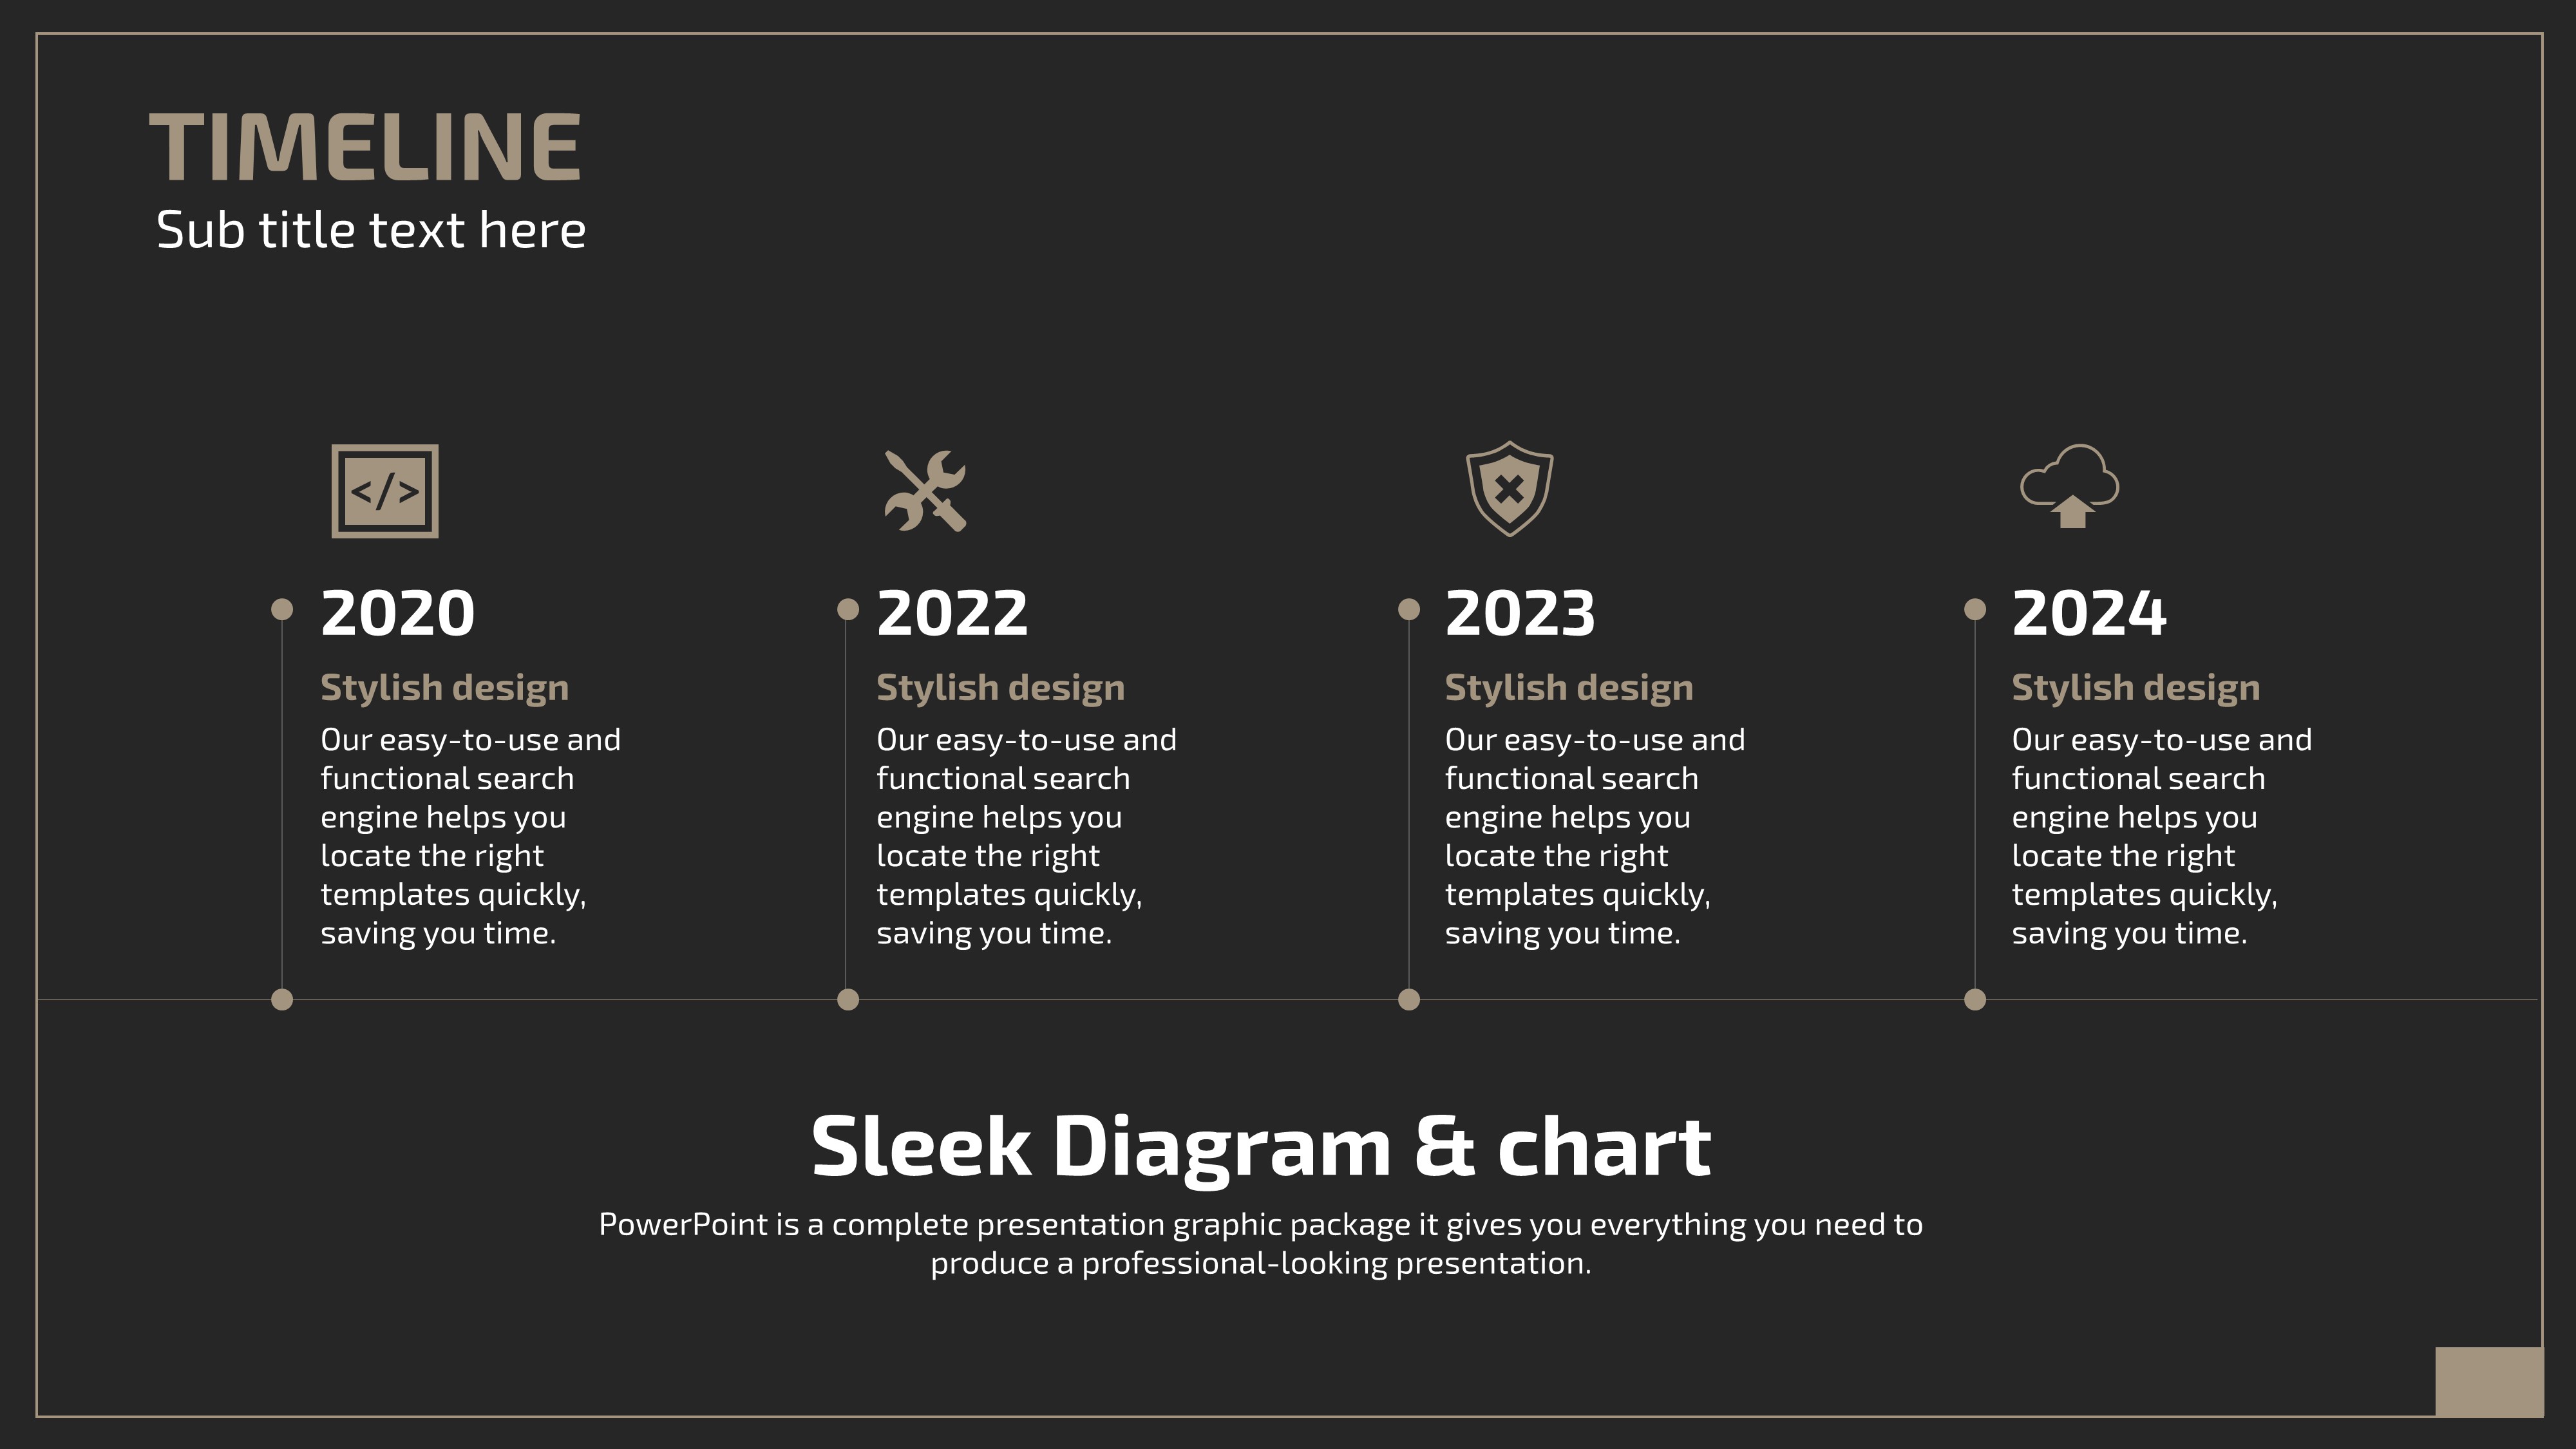
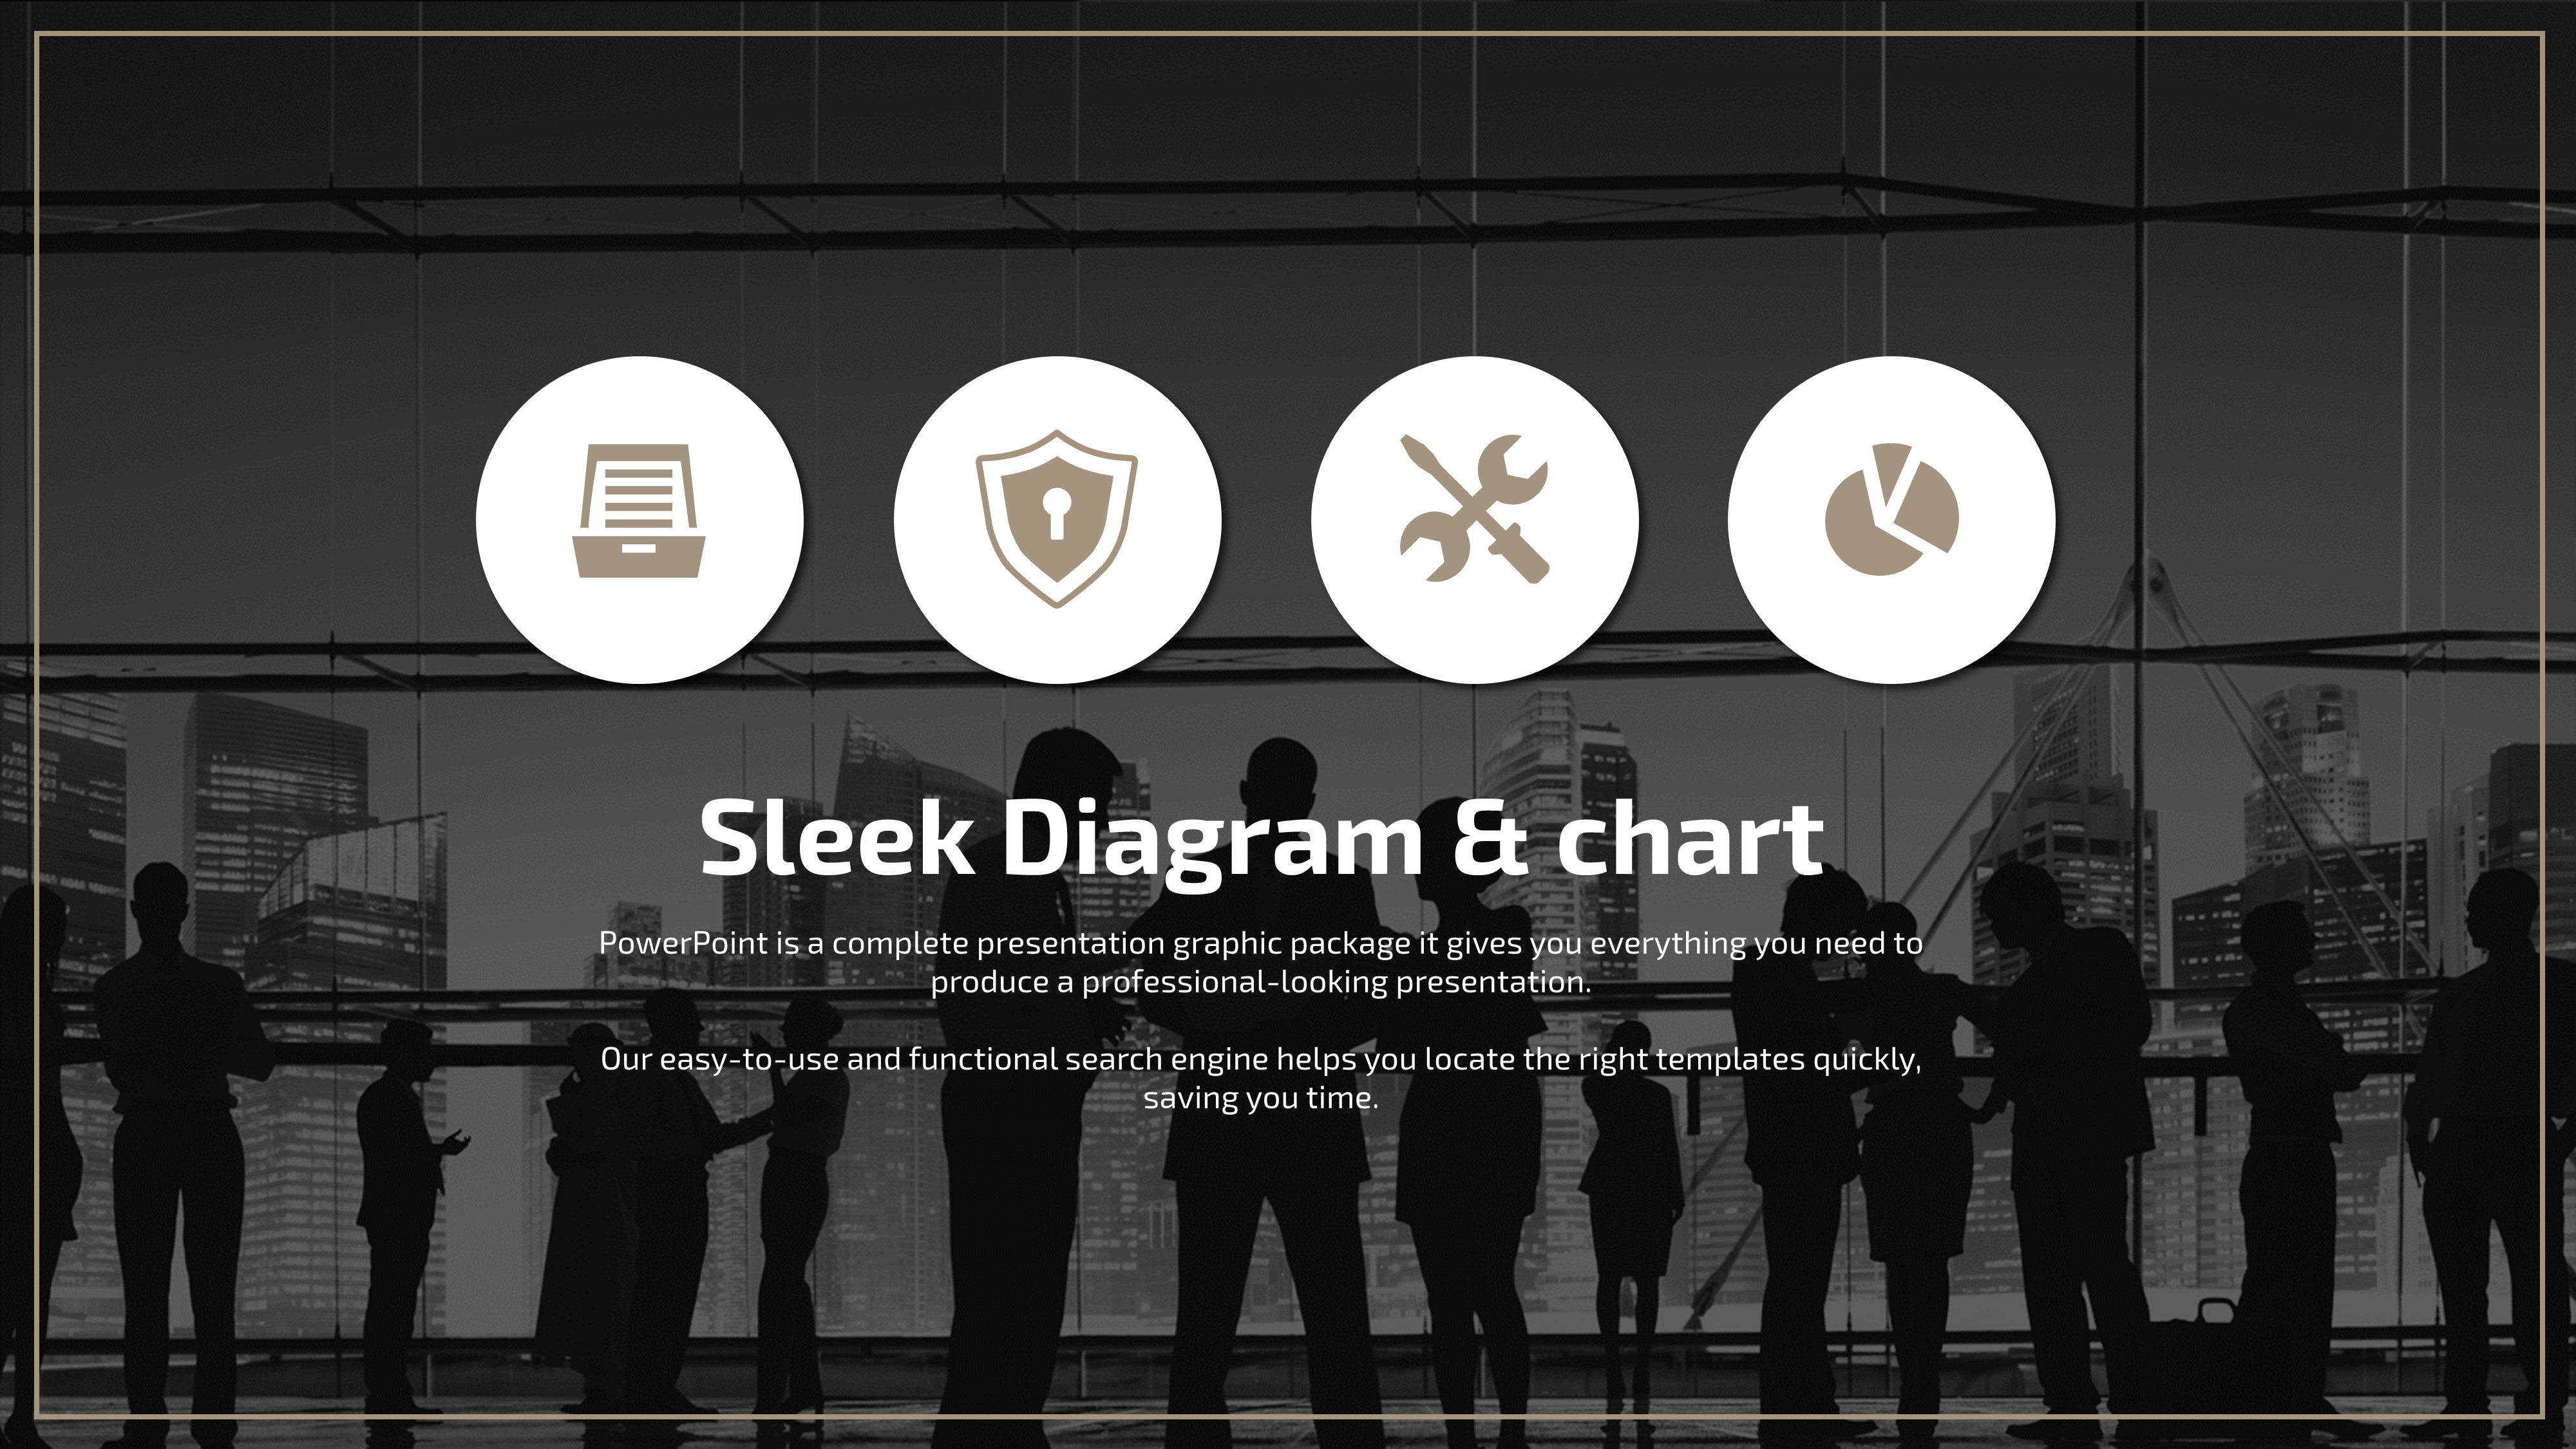
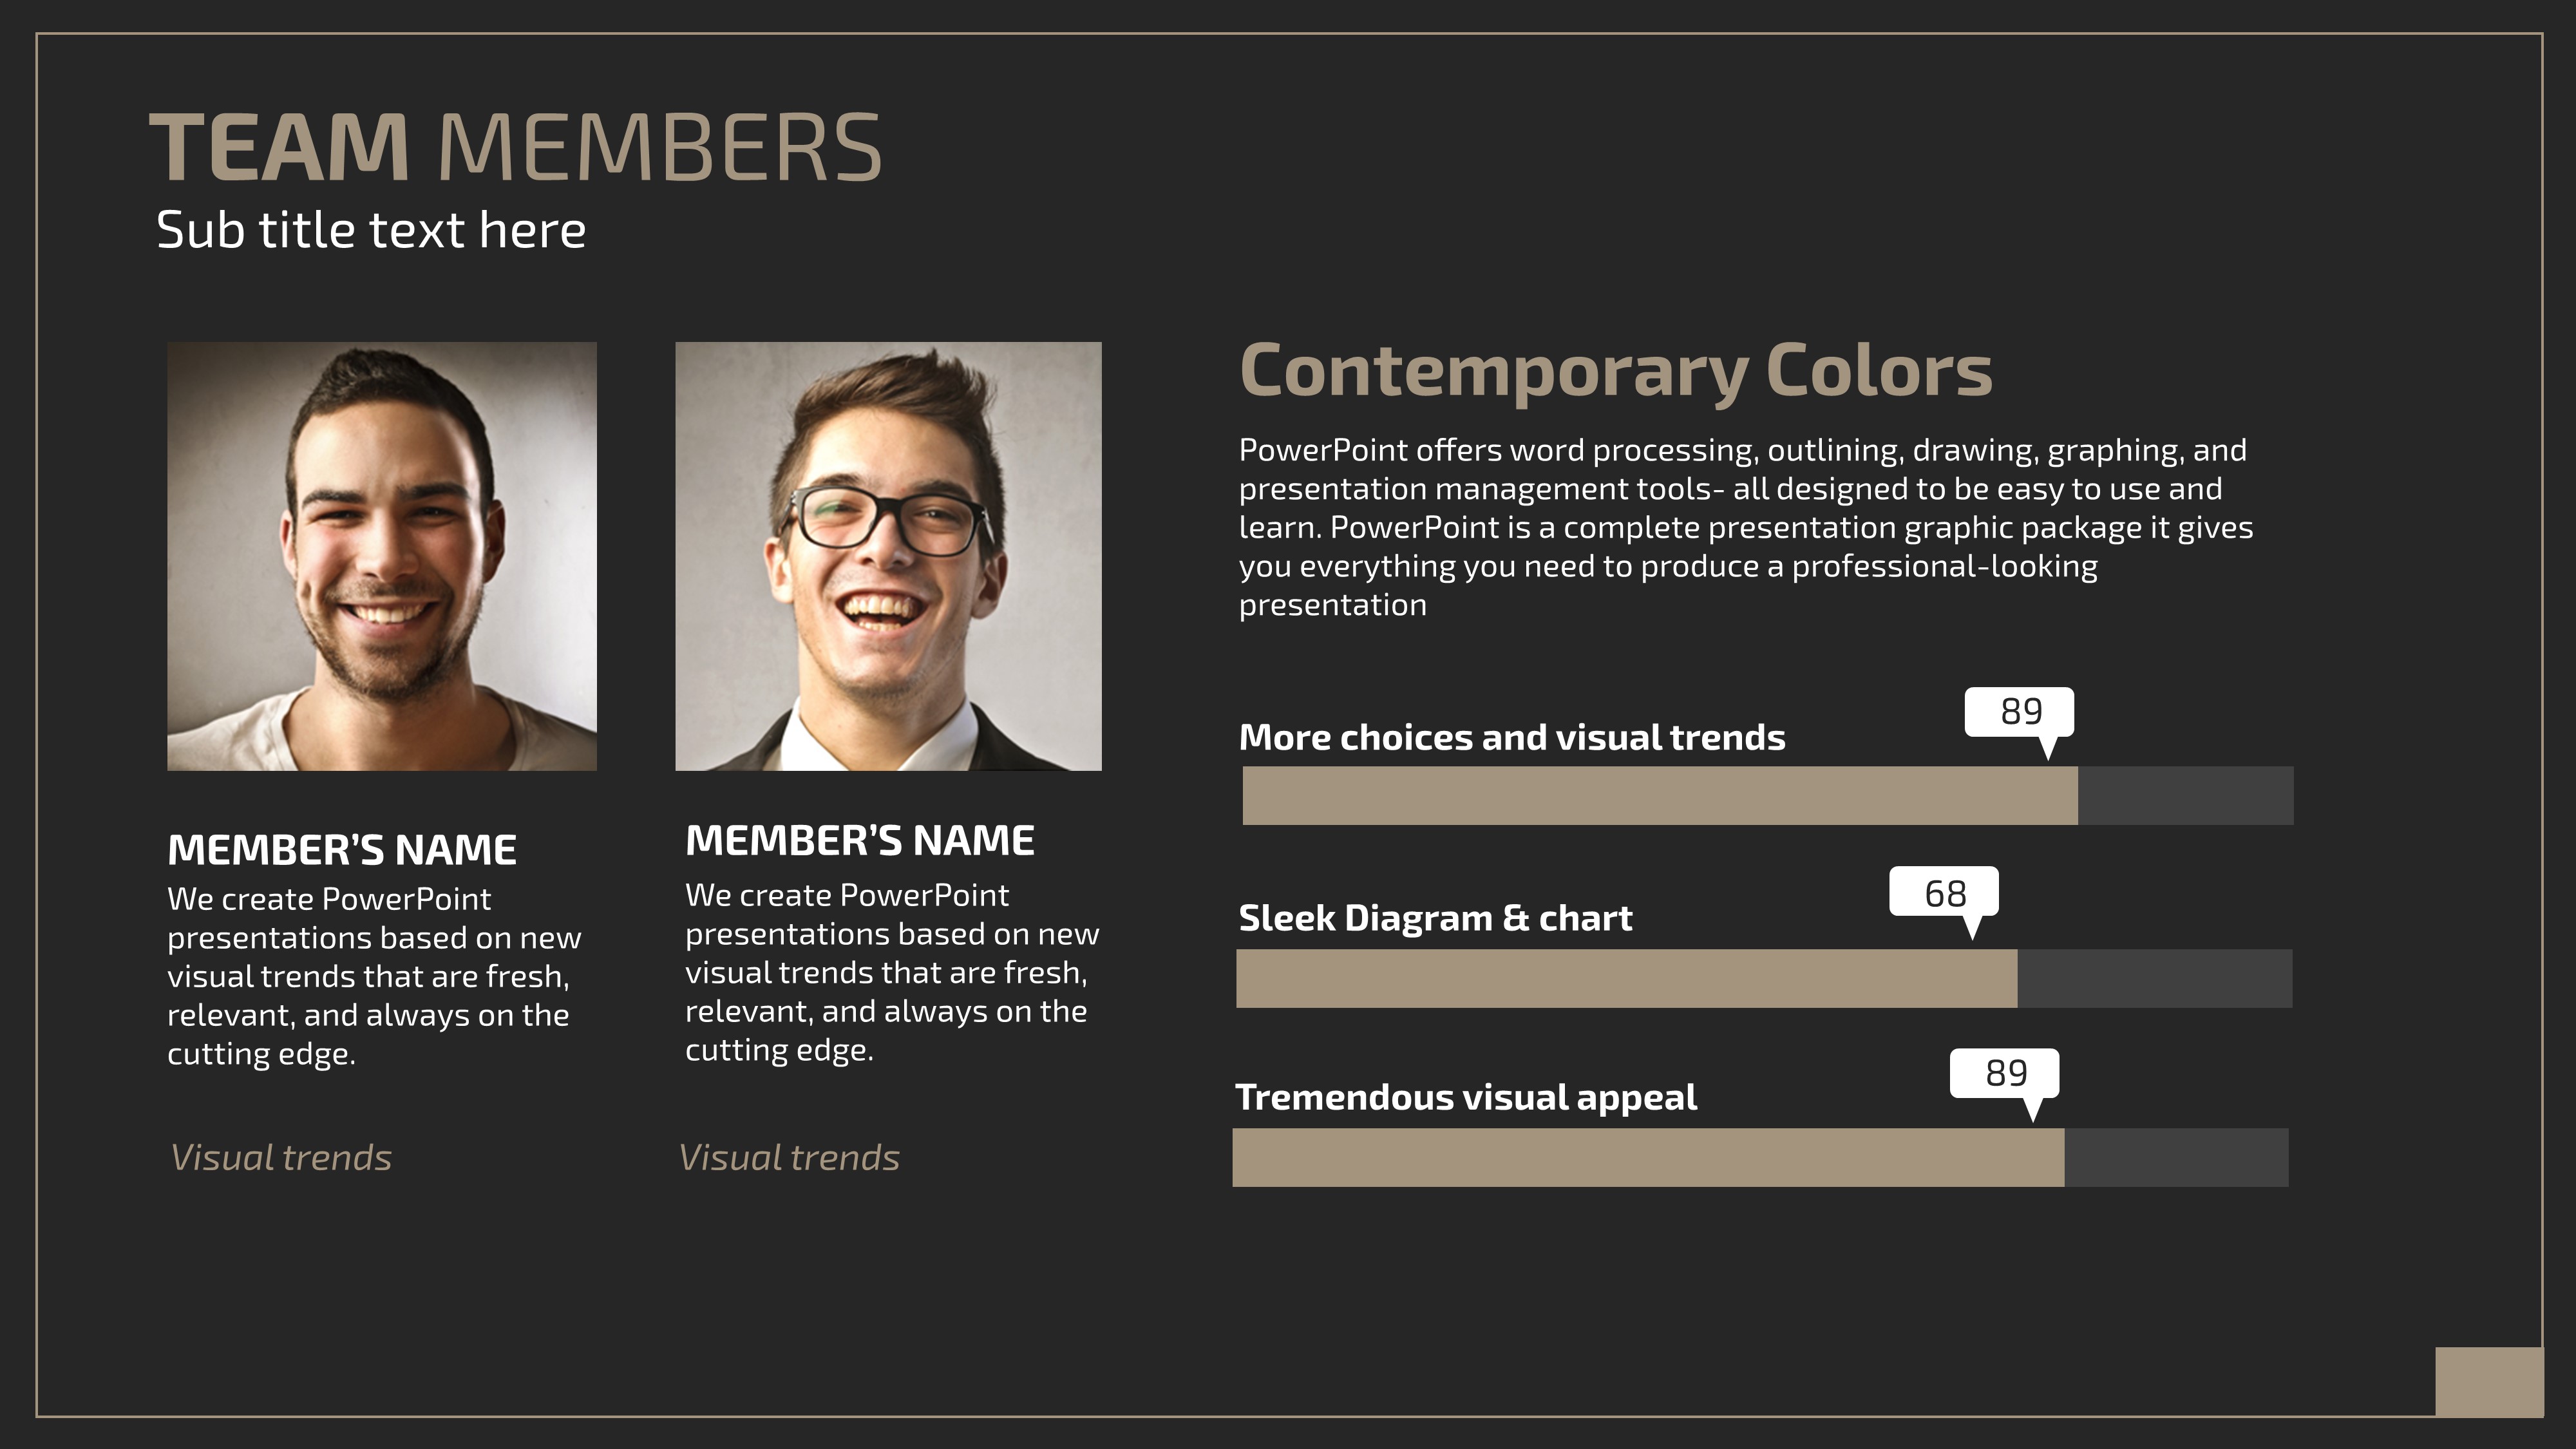
A professional PowerPoint template designed for cybersecurity and data security presentations. Built on a dark charcoal and black background with gold and beige-brown accent colors, this presentation deck delivers a commanding, trustworthy impression ideal for IT security topics. The 21-slide set includes a shield icon title slide, radar chart, line chart, column chart, radial diagram, and icon-based diagram slides, giving you a full suite of data visualization tools to clearly communicate complex security metrics and threat analysis. The balanced layout makes it easy to pair text explanations with charts on the same slide. Fully editable in PPTX format, this PowerPoint template is ready to use for security solution pitches, cyber threat reports, IT infrastructure briefings, and more. Whether you call it a slide deck, presentation, or security report, this template covers every scenario.
Usage Points
-
Main Usage
Ideal for corporate cybersecurity presentations, security solution pitches, IT infrastructure status reports, and threat analysis briefings where a professional, data-driven slide deck is required.
-
How to Use
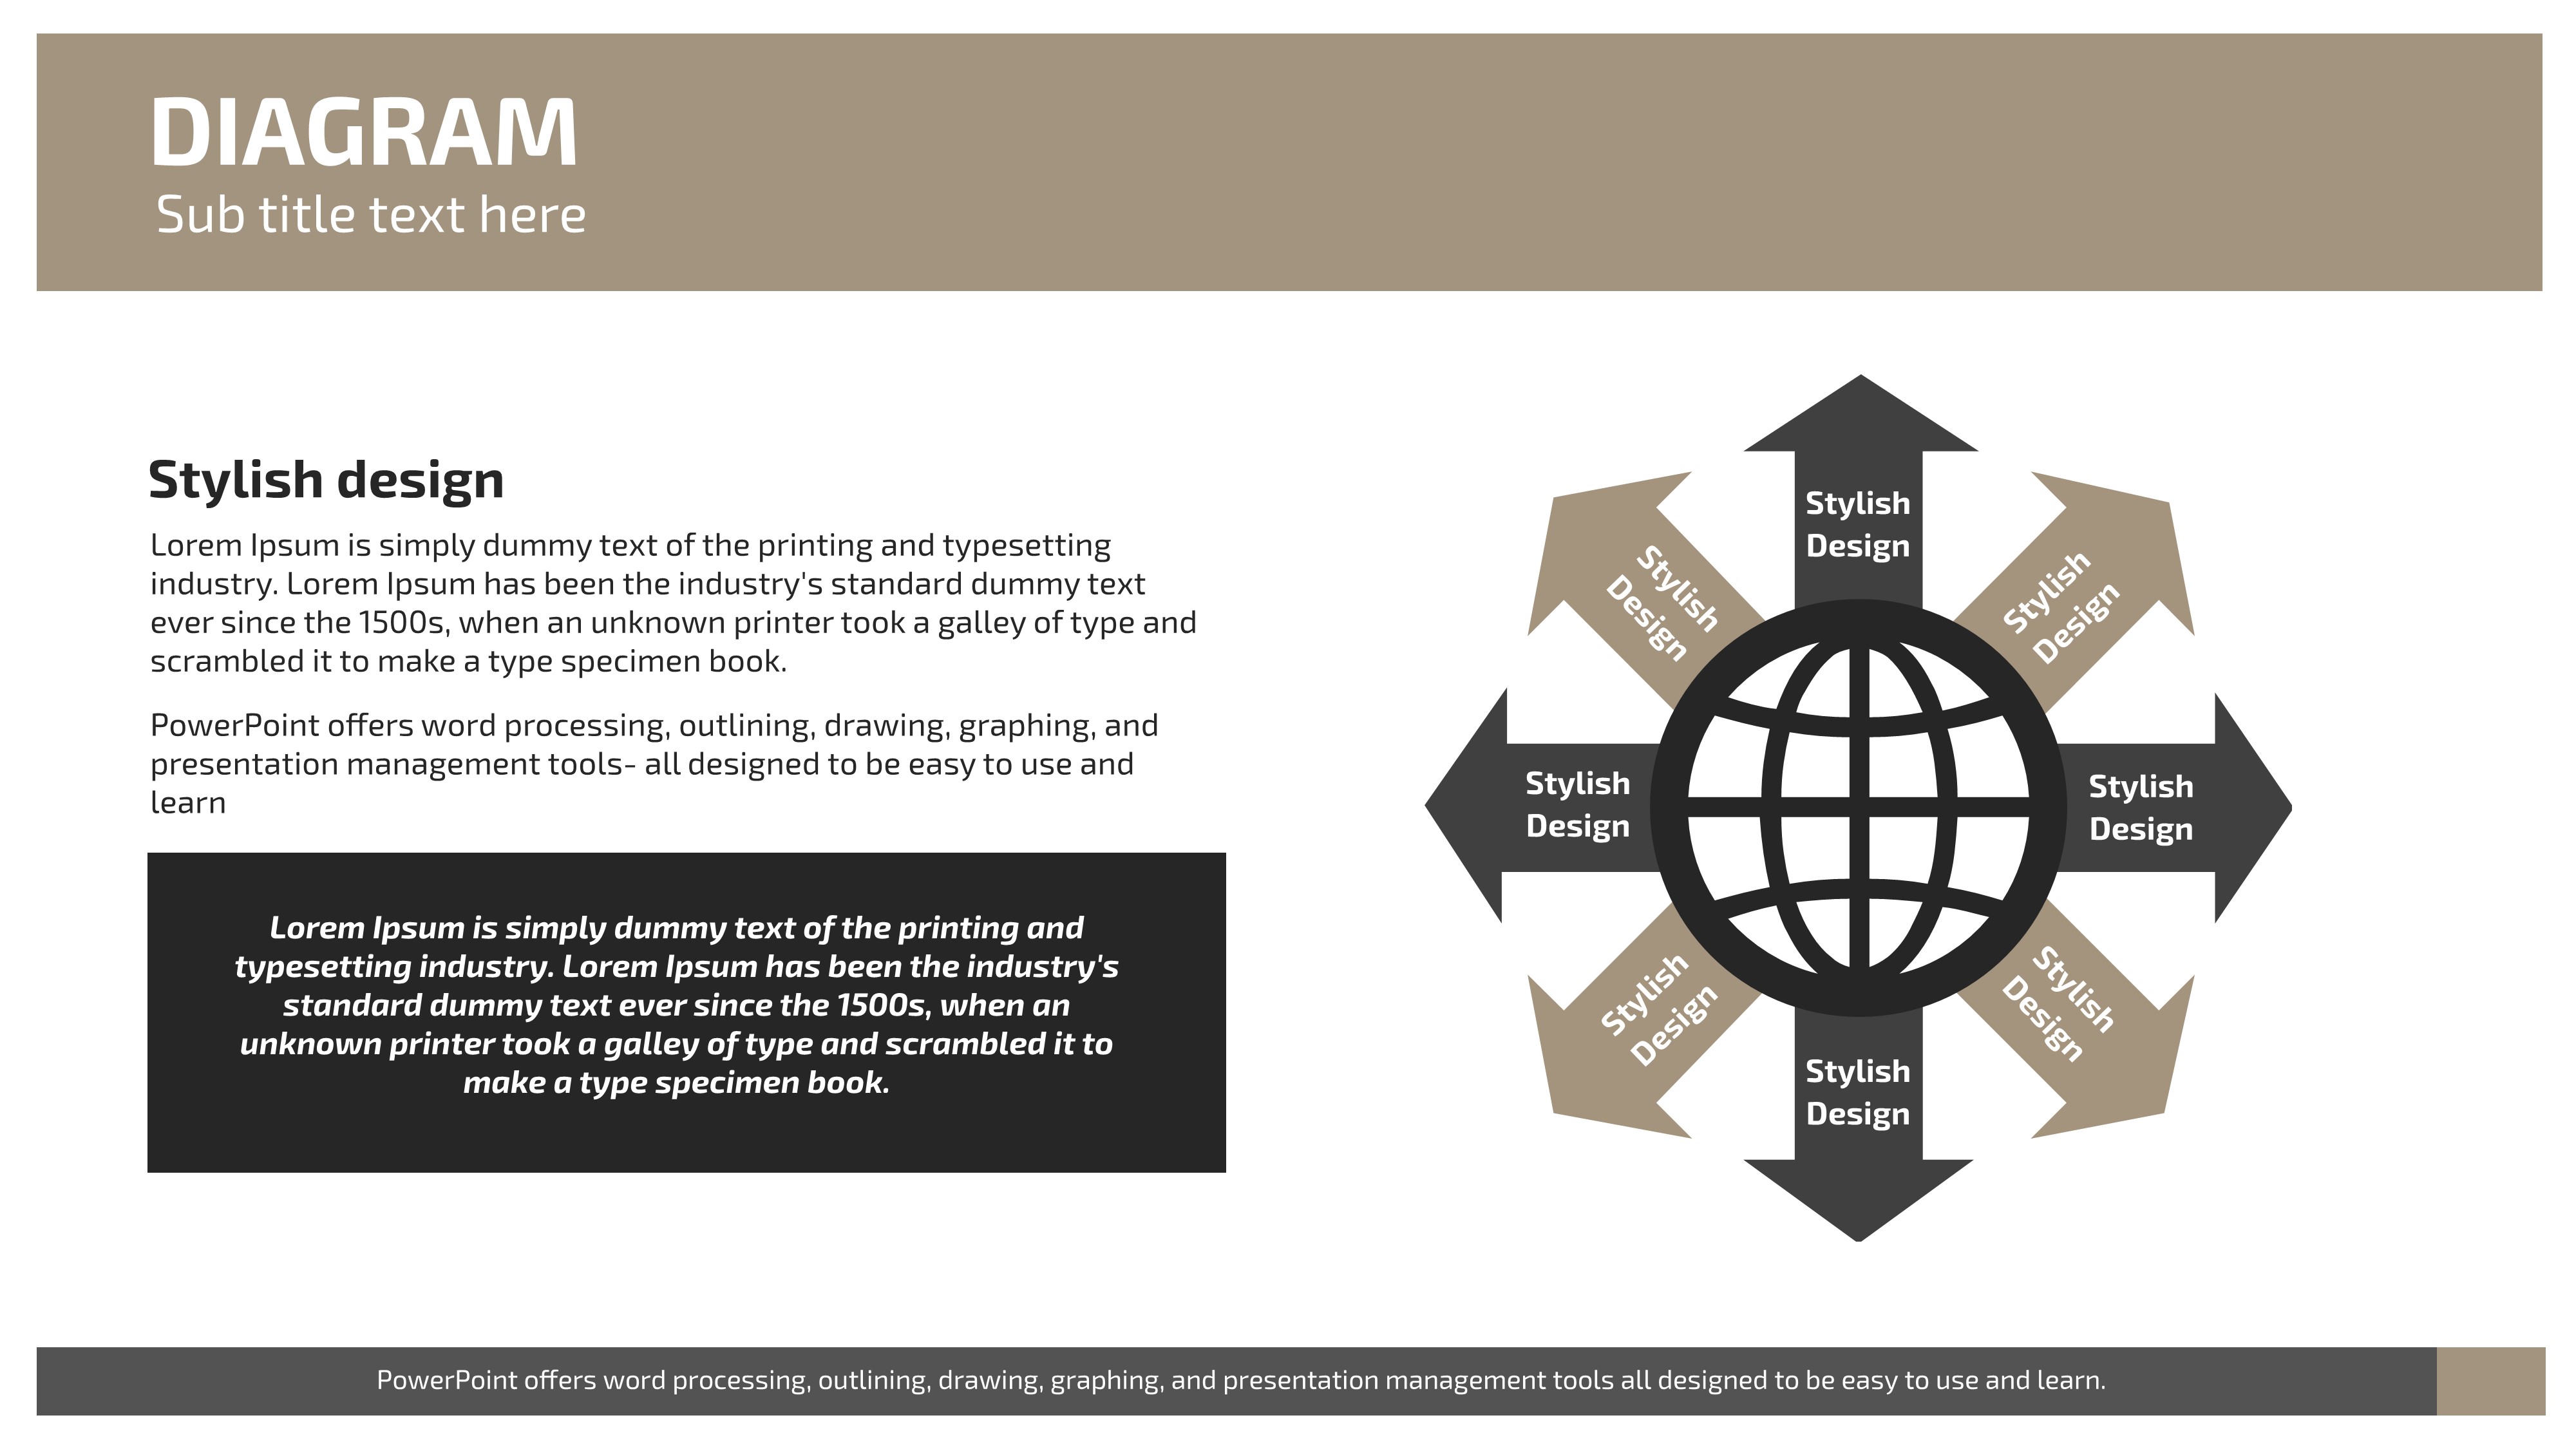
Open the PPTX file, update the shield icon title slide with your company name, then input your actual security metrics into the radar, column, and line chart slides. Use the radial diagram to map out your security strategy or framework visually.
-
Recommended For
Recommended for IT security managers, cybersecurity consultants, security solution sales and planning teams, and academic researchers presenting on information security topics who need a credible, data-rich presentation.
-
Slide Structure
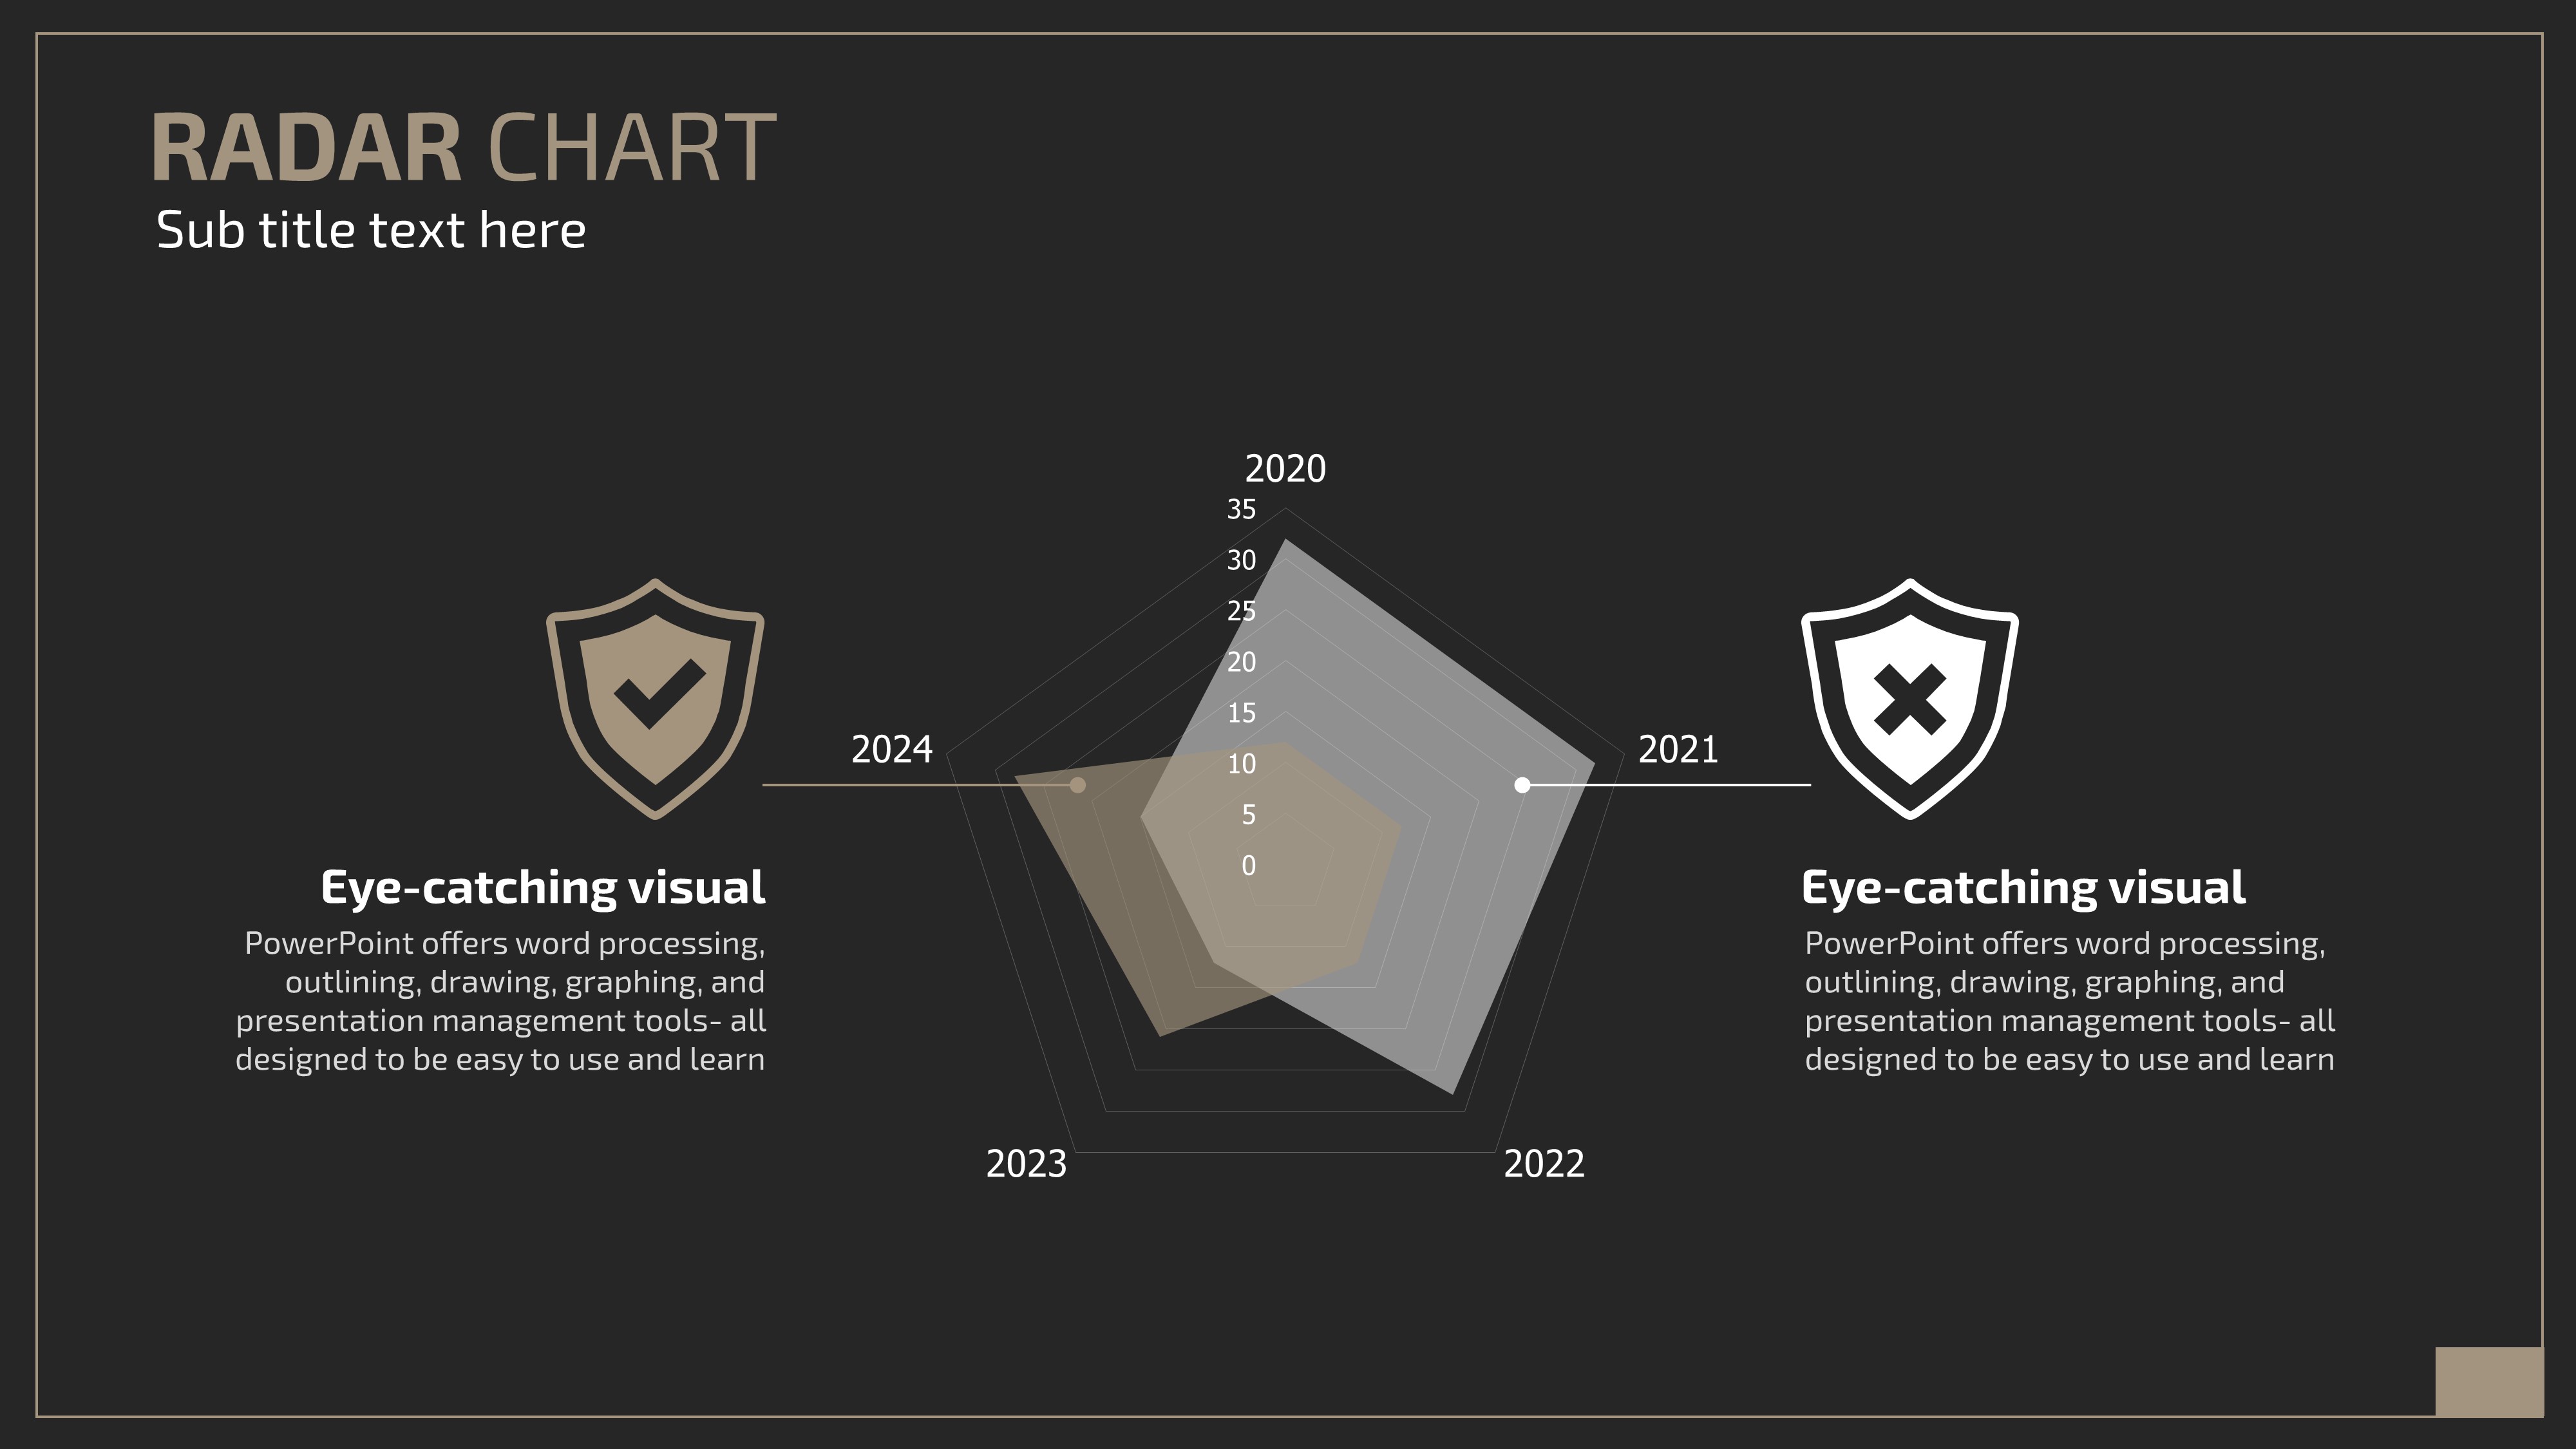
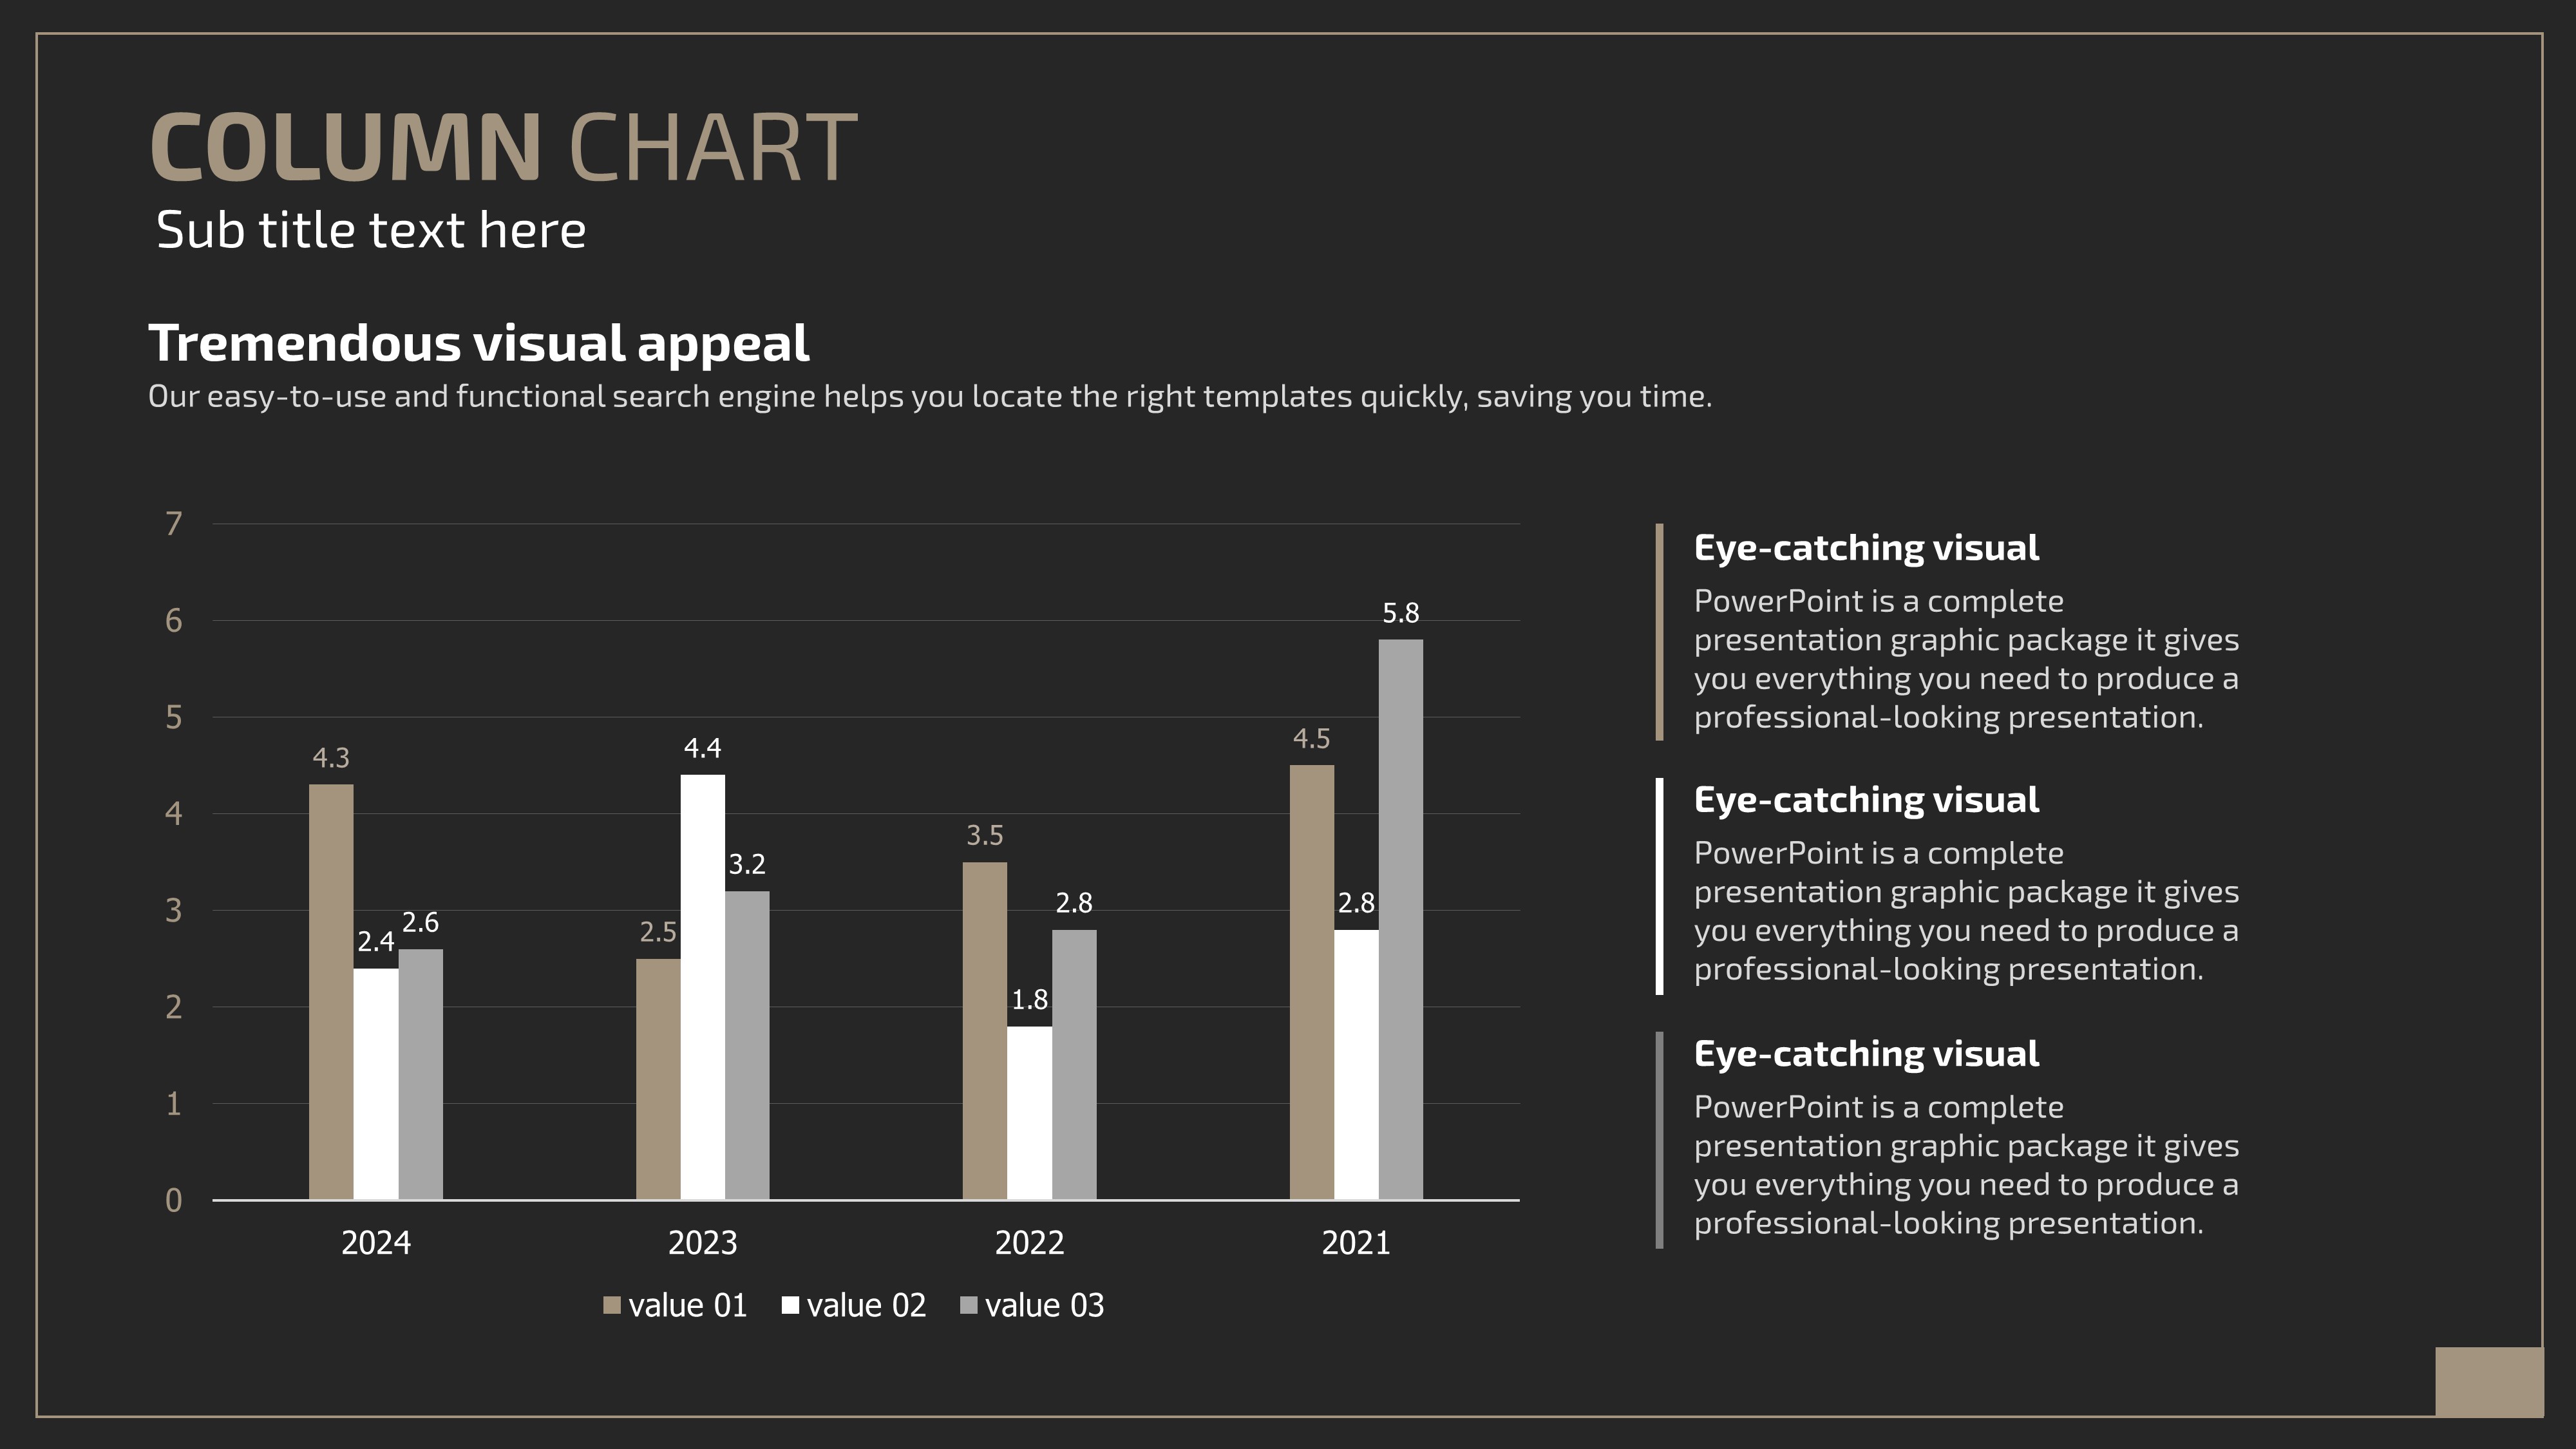
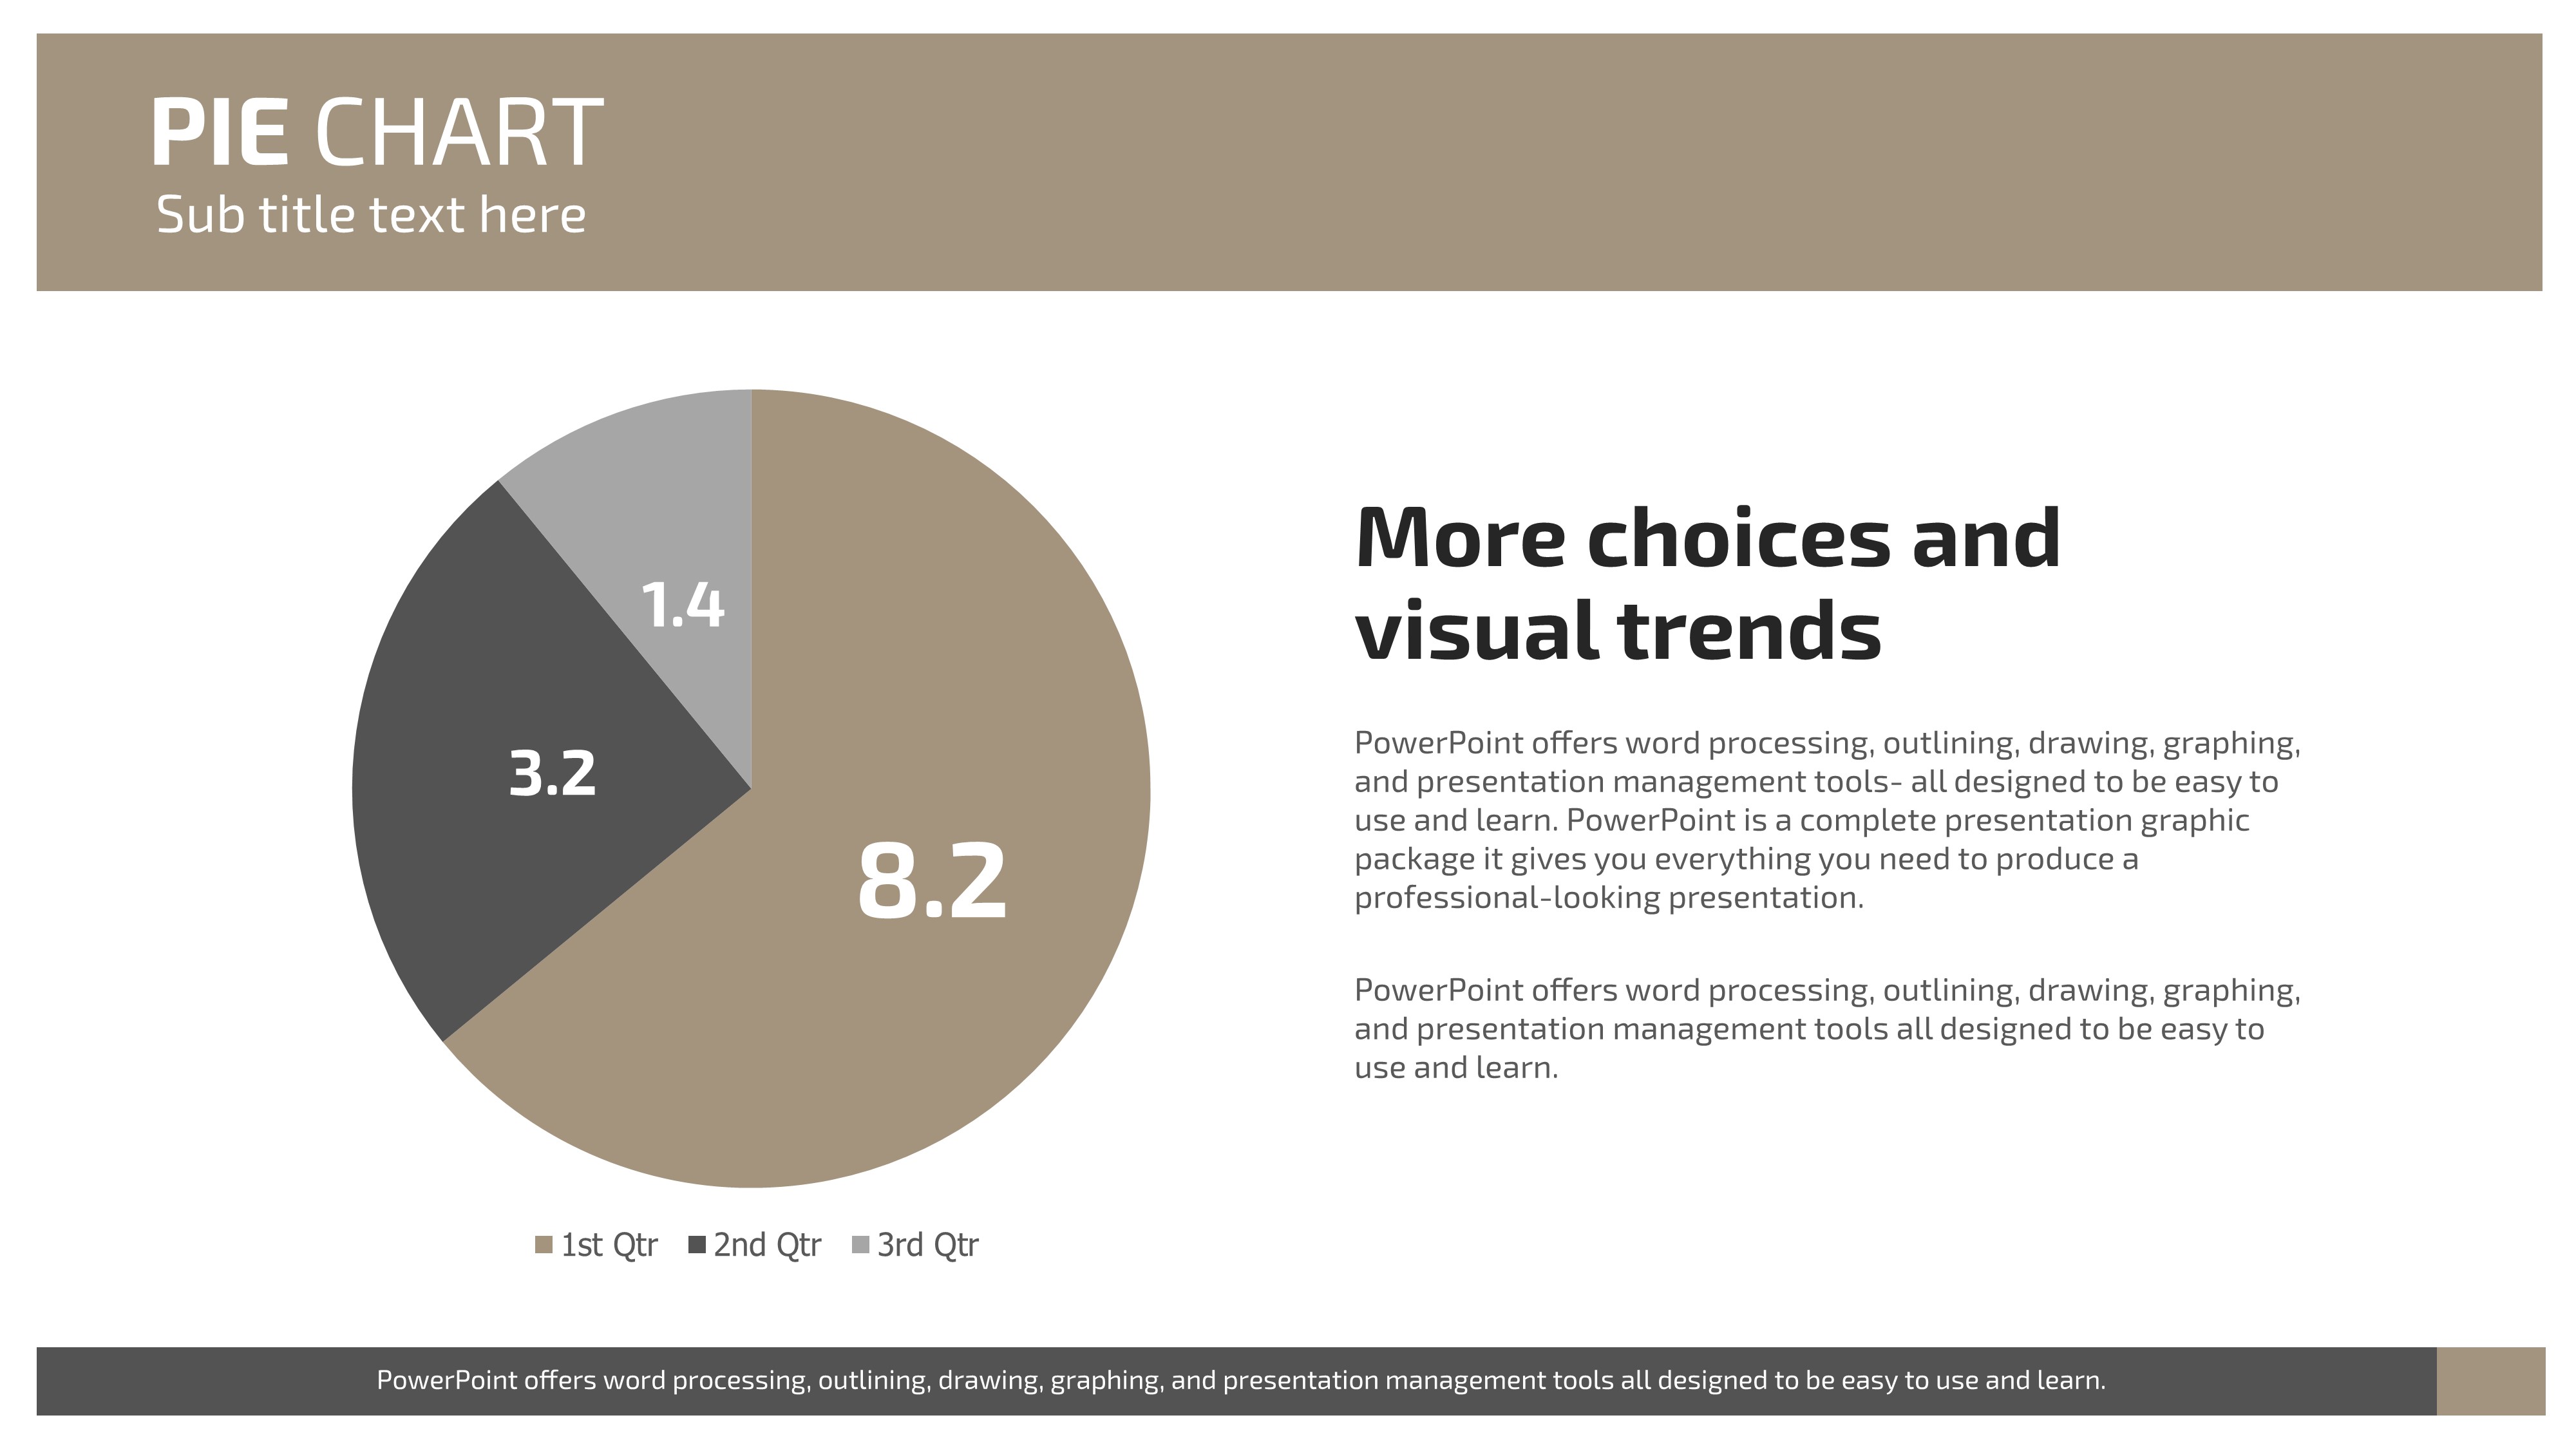
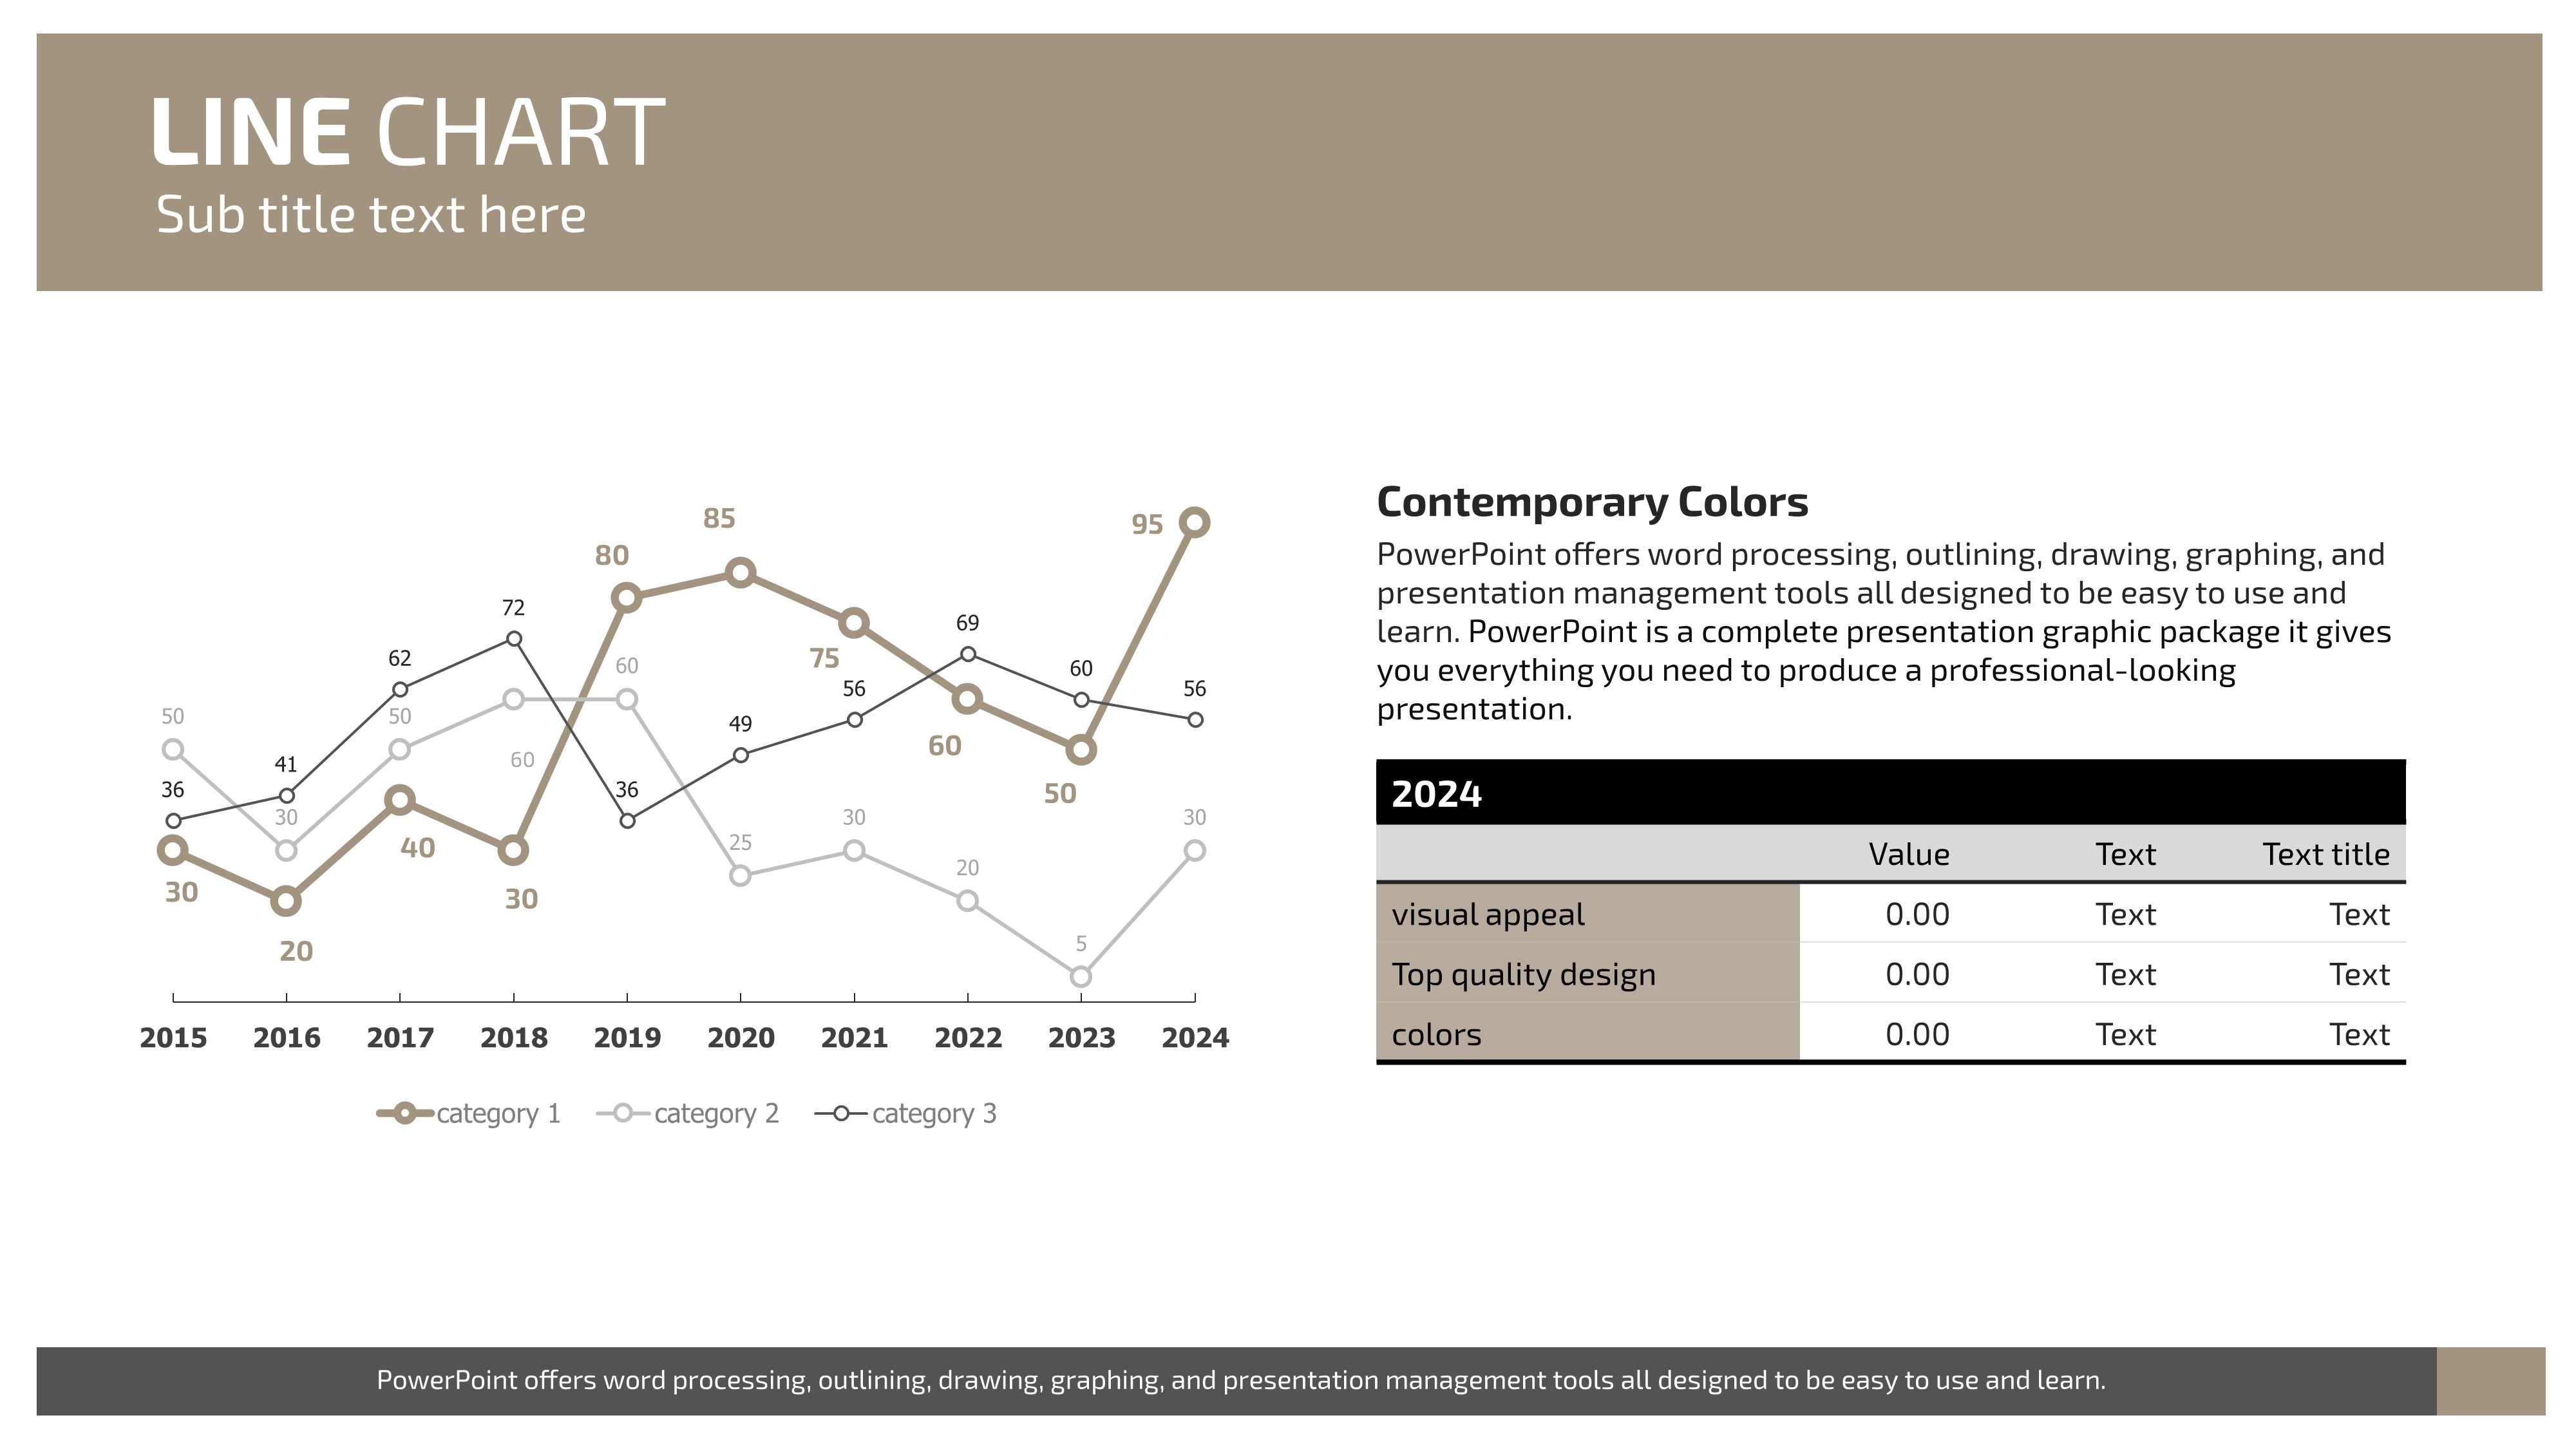
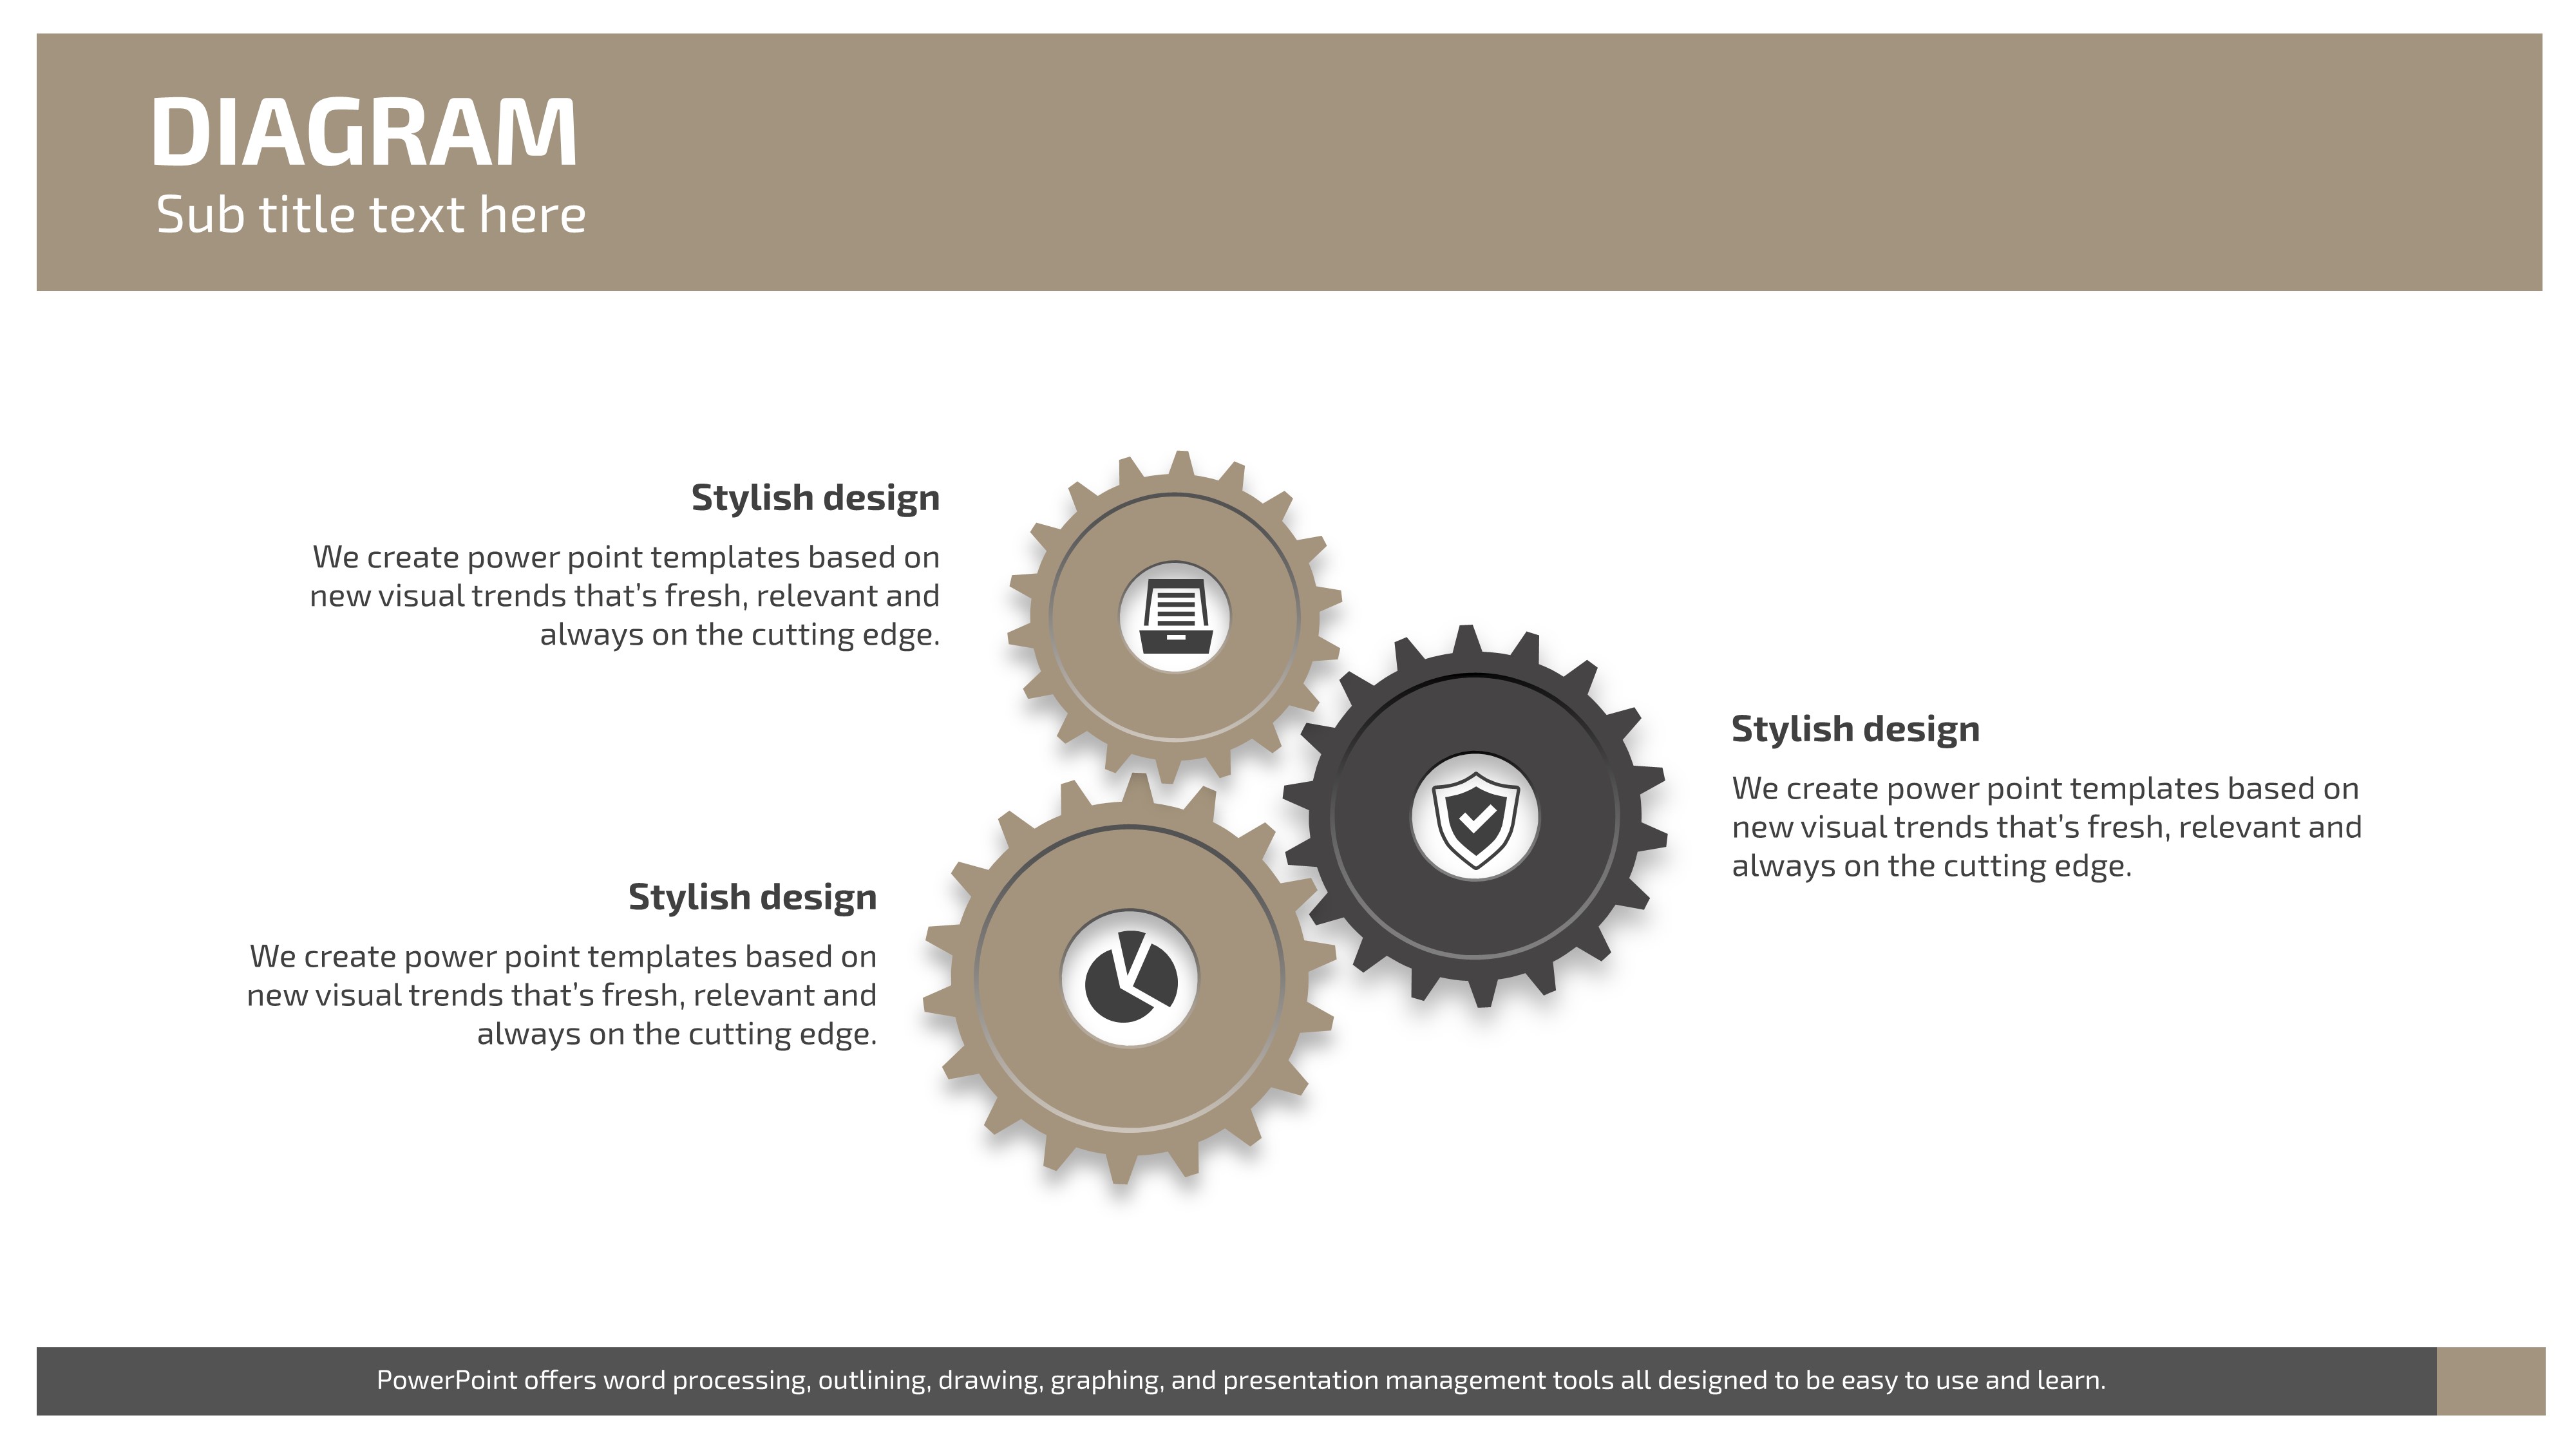
The 21-slide deck includes a dark shield icon cover, radar chart (year-over-year comparison), four-icon circular diagram, line chart, radial strategy diagram, column bar chart (annual data), and full-screen section divider slides for a complete security presentation flow.
Related Products
-

Big Data Presentation Template – Visually Appealing Design
#IT/Computer
-

Weather Forecast Presentation Template – Intuitive and Sleek Design
#IT/Computer
-

IOT Themed Portrait Presentation Template – Modern Design with Rich Visual Appeal
#IT/Computer
-

Application PowerPoint Wide Template – Sleek Design and Practicality
#IT/Computer
