Data Security Service Development Status – Utilizing Donut Chart
RJ0400056_13
- Last Update 06/02/2025
- File Size 0.7MB
- # of Slides 2
- File Format PPTX
- Slide Ratio 16:9
- Color
Keywords
- #Content-Based Slides
- #Design-Based Slides
- #Product/Service Introduction
- #Market and Competitor Analysis
- #Graph
- #Development Status
- #Market Share
- #Circles
- #Doughnut Chart
- #16:9
- #donut chart PowerPoint slide
- #pie chart presentation template
- #data ratio visualization
- #donut graph slide design
- #how to create donut chart in PowerPoint
About the Product
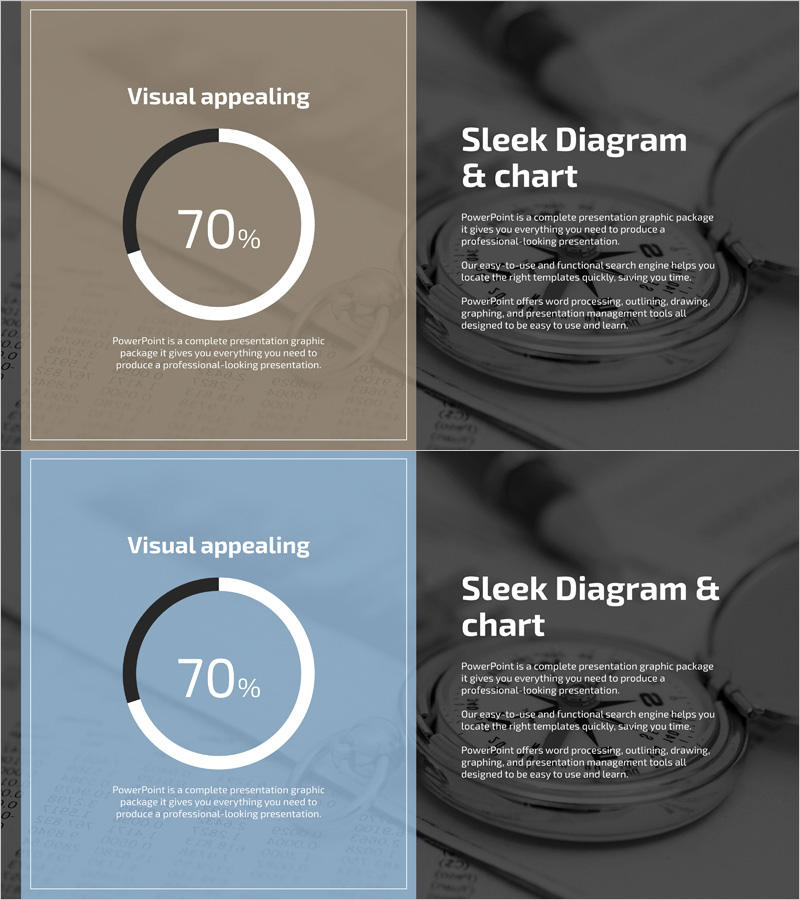
A professional donut chart PowerPoint slide set designed to visualize data security service development status and key performance metrics. This 2-slide presentation features a centered donut-shaped pie chart emphasizing 70% data ratio with supporting text, ideal for displaying market share, project completion rates, and service adoption metrics. The design combines beige and sky blue backgrounds with white chart elements and dark borders for strong visual contrast. Perfect for corporate presentations, competitive analysis reports, and service introduction materials. Delivered in 16:9 widescreen PPTX format compatible with all presentation environments.
Usage Points
-
Main Usage
Emphasizes single-metric data (market share, project completion, service adoption rate, development progress) through a centered donut chart design that immediately captures audience attention and communicates key numerical insights at a glance.
-
How to Use
Deploy in IT and technology service presentations as a status analysis slide, insert into executive reports and investor pitch decks to highlight performance indicators, or use in quarterly business reviews to reinforce data credibility with visual emphasis.
-
Recommended For
IT security and software companies presenting development status, service providers analyzing market penetration, project teams sharing progress updates, executives delivering quarterly performance reports, and investors seeking clear metric visualization in pitch materials.
-
Slide Structure
Slide 1: Beige background with center-aligned donut chart (70% emphasis, white fill, dark border) and descriptive text below. Slide 2: Sky blue background with identical donut chart layout for color variation. Both slides in 16:9 widescreen PPTX format with consistent typography and spacing.
Related Products
-

Graph of Analysis of Transportation Development Status
#Product/Service Introduction #Market and Competitor Analysis #Graph
-

Website Technology Development Status Graph – Market Share and Trends
#Product/Service Introduction #Market and Competitor Analysis #Graph
-

Analysis graph of market share progress
#Product/Service Introduction #Market and Competitor Analysis #Graph
-

Analysis of Work Progress – Utilizing Pie Chart
#Product/Service Introduction #Market and Competitor Analysis #Graph
