Competitor Analysis Graph & Table by Year
RJ0400056_17
- Last Update 06/02/2025
- File Size 0.2MB
- # of Slides 2
- File Format PPTX
- Slide Ratio 16:9
- Color
Keywords
- #Content-Based Slides
- #Design-Based Slides
- #Market and Competitor Analysis
- #Diagram
- #Graph
- #Competitor Analysis
- #Competitive Advantage
- #Table
- #Line
- #Standard Table
- #Line Chart
- #16:9
- #line chart PowerPoint slide
- #annual trend analysis template
- #competitor analysis presentation
- #multi-series data visualization
- #market performance chart download
- #business analytics slide template
About the Product
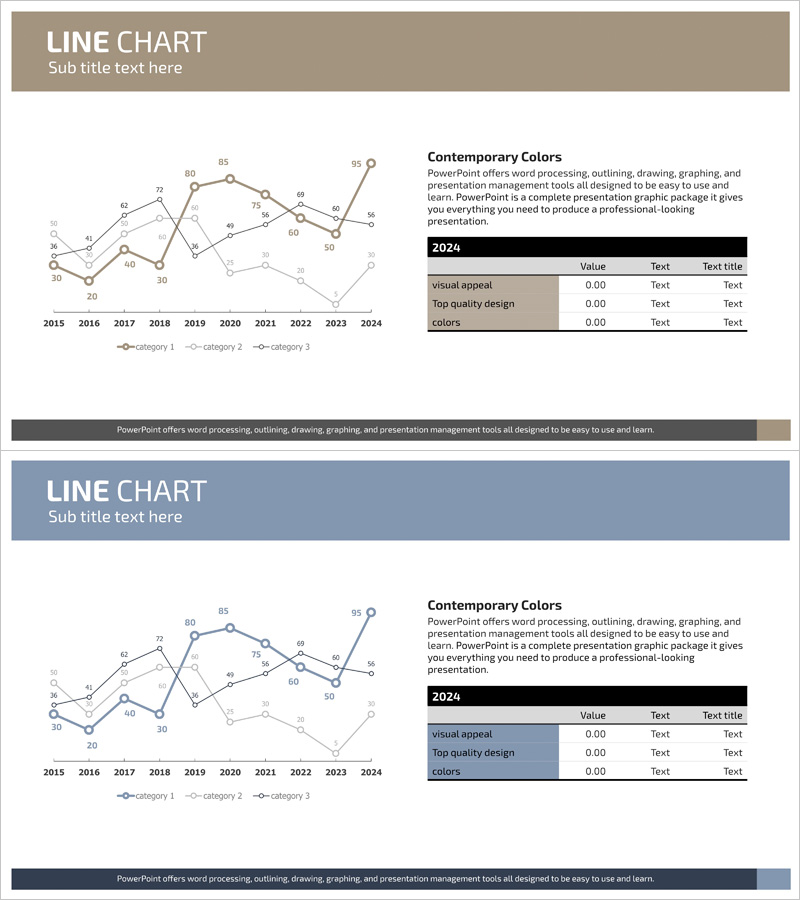
A professional PowerPoint slide featuring a multi-series line chart tracking competitor performance data from 2015 to 2024. The visualization displays three data series across ten years, with precise data points and trend lines clearly marked. A summary data table positioned on the right side provides exact numerical values for quick reference. The slide combines a neutral beige header with blue accent tones, creating a polished appearance suitable for business presentations, market analysis reports, and competitive intelligence briefings. All chart elements, axis labels, legend items, and table values are fully editable, allowing seamless customization with your actual competitor or market data. Two slide layouts with different color schemes are included for presentation flexibility.
Usage Points
-
Main Usage
Compare competitor performance trends across multiple years using three distinct data series displayed as line charts. The accompanying data table provides precise numerical values, enabling comprehensive market analysis, competitive positioning assessment, and strategic business reporting.
-
How to Use
Input your annual or quarterly data for three competitors or metrics into the chart fields. The line chart automatically updates with your values. Customize the legend labels to reflect actual company names or KPI titles, adjust color schemes to match your brand, and synchronize table data to ensure consistency across all visual elements.
-
Recommended For
Marketing strategists, business analysts, competitive intelligence professionals, management consultants, investor relations teams, and executives preparing market analysis presentations. Ideal for quarterly business reviews, annual strategy presentations, competitive landscape assessments, and data-driven decision-making meetings.
-
Slide Structure
Slide 1: Beige header with 3-series line chart spanning 2015–2024 (approximately 10 data points per series) and a right-aligned summary table (3 rows × 4 columns with headers). Slide 2: Blue header variant with identical chart structure for color scheme flexibility and presentation consistency.
Related Products
-

Dawn City Theme Competitor Analysis Graph – Understanding Market Trends
#Market and Competitor Analysis #Diagram #Graph
-

Competitor Comparison Graph & Table - Essential Tool for Market Analysis
#Market and Competitor Analysis #Diagram #Competitor Analysis
-

Comparison Graph of Yearly Trends – Market and Competitor Analysis
#Market and Competitor Analysis #Diagram #Graph
-

Visualizing Market Analysis with Line Chart – Harmony of Mint and Orange
#Market and Competitor Analysis #Diagram #Graph
