Data Analysis Radial Graph for Performance Visualization – Trust and Professionalism
RJ0400056_5
- Last Update 06/02/2025
- File Size 0.2MB
- # of Slides 2
- File Format PPTX
- Slide Ratio 16:9
- Color
Keywords
- #Content-Based Slides
- #Design-Based Slides
- #Product/Service Introduction
- #Business Introduction
- #Diagram
- #Graph
- #Composition
- #Technological Status
- #Cluster
- #Other
- #Chain Diagram
- #Radar Chart Spider Chart
- #16:9
- #radial chart PowerPoint
- #radar chart template
- #data analysis slide
- #5-axis comparison chart
- #performance visualization PowerPoint
- #radial diagram slide
About the Product
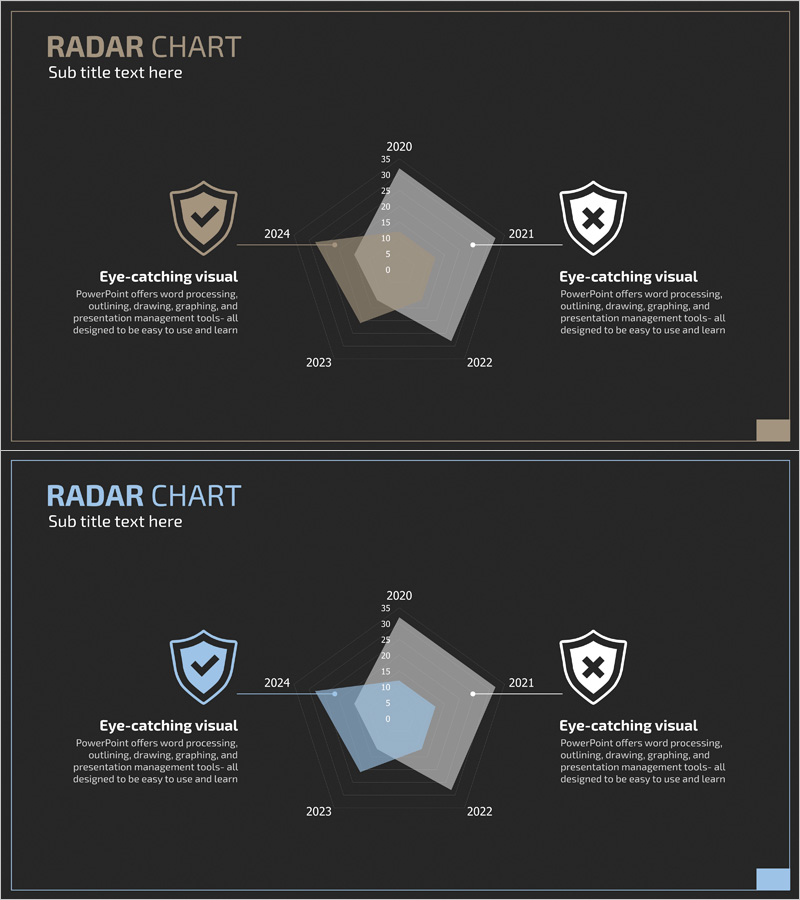
A 5-axis radial chart PowerPoint slide for multi-dimensional data visualization. Set against a dark gray background, this slide features beige and blue transparent overlay areas to display multiple data series simultaneously. Each axis is labeled with years (2020–2024) and numerical scales (0–35) to track performance changes over time. Checkmark and X-mark icons with descriptive text on both sides enable positive and negative evaluation visualization. This 2-slide set is ready to use for various data analysis presentations and business reports.
Usage Points
-
Main Usage
Designed to compare multiple indicators simultaneously and visualize performance changes over time. The radial structure displays five or more data series on a single slide, making complex data patterns and trends immediately clear to audiences.
-
How to Use
Apply this slide to technology assessments, capability analysis, year-over-year performance reviews, and competitive benchmarking presentations. Edit axis values to input actual data and customize overlay colors to match your organization's brand guidelines.
-
Recommended For
Ideal for executive reports, business performance presentations, technical capability evaluations, marketing analysis materials, and consulting proposals. Recommended for professionals including executives, analysts, consultants, and marketers who need to compare complex metrics.
-
Slide Structure
Two radial chart variations with 5 axes each. First slide features beige and gray transparent areas comparing two data series; second slide uses blue transparent area to emphasize a single series. Both include icon and descriptive text areas on left and right sides.
Related Products
-

Construction Work Puzzle Diagram – Cluster-Based Structure
#Product/Service Introduction #Business Introduction #Diagram
-

Sailing Travel Risk Management Radar Chart
#Product/Service Introduction #Business Introduction #Diagram
-

More Choices in Visual Trends for Effective Presentation Design
#Product/Service Introduction #Business Introduction #Graph
-

Goal Setting & Radial Graph – Intuitive Data Visualization
#Business Introduction #Market and Competitor Analysis #Diagram
