Market Analysis Graph by Year – Effective Tool for Competitor Analysis
RJ0400056_11
- Last Update 06/01/2025
- File Size 0.2MB
- # of Slides 2
- File Format PPTX
- Slide Ratio 16:9
- Color
Keywords
- #Content-Based Slides
- #Design-Based Slides
- #Market and Competitor Analysis
- #Graph
- #Competitor Analysis
- #Market Analysis
- #Column
- #Grouped Column
- #16:9
- #grouped column chart PowerPoint
- #multi-series bar chart template
- #year-over-year market analysis slide
- #competitor comparison chart
- #sales trend PowerPoint template
About the Product
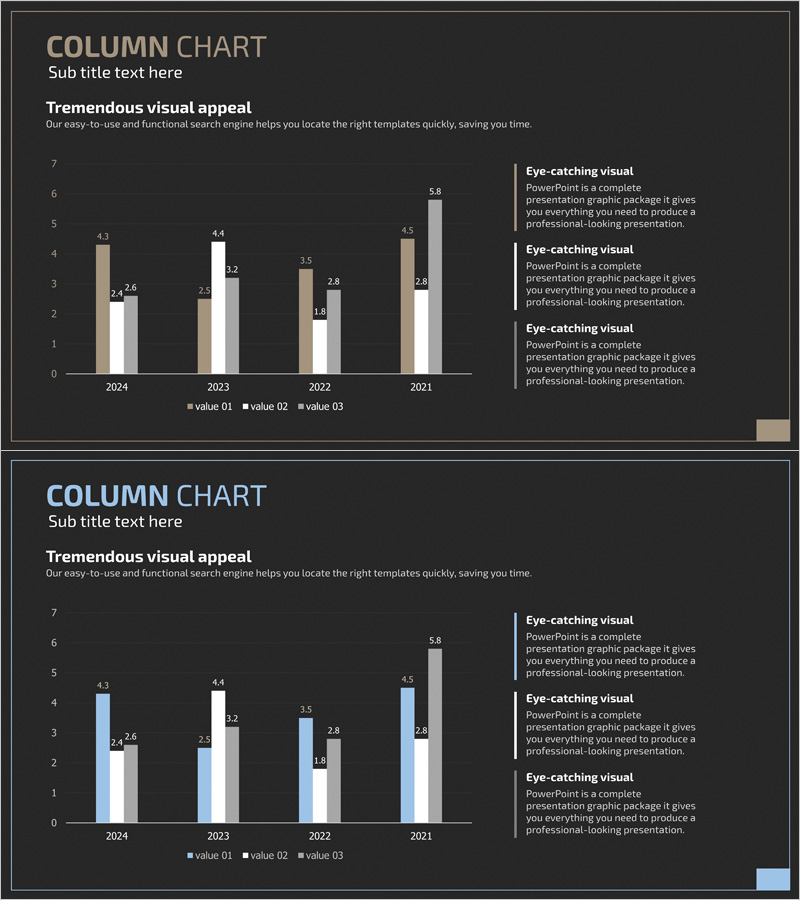
A grouped column chart PowerPoint slide template designed to compare market data across 4 years (2024–2021) with 3 data series (value 01, 02, 03) displayed side-by-side. The dark background with beige, white, and light blue column bars provides clear visual distinction for multi-metric comparison. Ideal for competitor analysis, market share trends, and sales performance presentations. This ready-to-use slide deck supports business reports, marketing plans, and investor pitch decks requiring simultaneous comparison of multiple indicators.
Usage Points
-
Main Usage
This slide enables side-by-side comparison of multiple data series across consecutive years, making it ideal for analyzing market trends, competitor performance, and departmental metrics simultaneously. The grouped layout allows viewers to compare both year-over-year changes and relative performance between series at a glance.
-
How to Use
Insert this slide into business reports, marketing plans, or investor presentations in the market analysis or performance review section. Replace value labels with your actual data, update the legend (value 01, 02, 03) with your metric names, and adjust colors if needed. The 2-slide set offers alternative color schemes for flexibility.
-
Recommended For
Executives, marketing teams, sales departments, and strategy planners presenting quarterly or annual performance reviews, competitive benchmarking, and market share analysis. Particularly suited for B2B proposals, consulting reports, financial analysis decks, and board presentations requiring multi-metric comparison.
-
Slide Structure
2-slide set featuring identical data structure with alternative color palettes (beige-white-light blue vs. light blue-white-beige). Each slide displays 4 years (2024, 2023, 2022, 2021) × 3 data series in grouped column format with Y-axis range 0–7 and numeric labels on each column.
Related Products
-

Startup Company Market Analysis Graph – Competition and Growth
#Market and Competitor Analysis #Diagram #Graph
-

Vertical Bar Cluster Analysis Graph – Market and Competitor Analysis
#Market and Competitor Analysis #Graph #Competitor Analysis
-

Clustered Vertical Bar Graph for Market Analysis – Data Insights
#Market and Competitor Analysis #Graph #Competitor Analysis
-

Comparative Analysis of Vertical Bar Bundles
#Market and Competitor Analysis #Graph #Competitor Analysis
