Data Market Analysis Circle Chart – Insightful Visuals
RJ0400056_15
- Last Update 06/02/2025
- File Size 0.2MB
- # of Slides 2
- File Format PPTX
- Slide Ratio 16:9
- Color
Keywords
- #Content-Based Slides
- #Design-Based Slides
- #Product/Service Introduction
- #Market and Competitor Analysis
- #Graph
- #Composition
- #Market Analysis
- #Circles
- #Pie Chart
- #16:9
- #pie chart PowerPoint
- #pie chart slide template
- #market analysis data visualization
- #ratio chart presentation
- #how to create pie chart in PowerPoint
About the Product
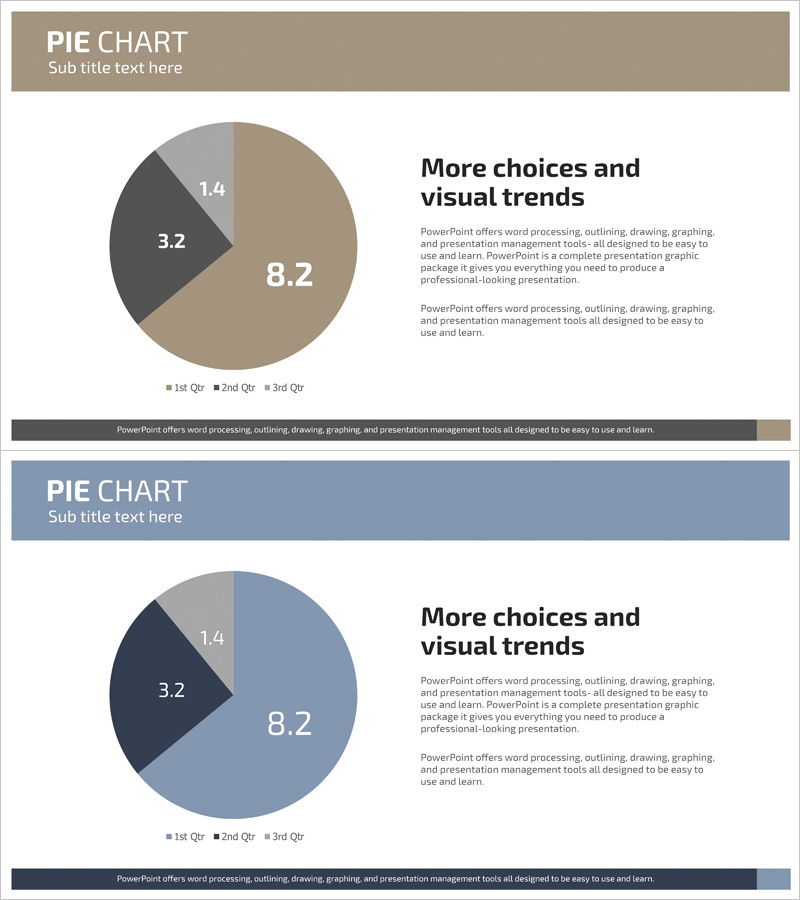
A professional pie chart PowerPoint slide optimized for market analysis and data visualization presentations. Features a 3-segment circular chart with a sophisticated color palette of beige, gray, and charcoal tones that convey business credibility. Each segment displays numerical data clearly, while the right-side text area provides space for detailed insights and interpretation. The 2-slide set includes two color themes (beige and blue) to match your presentation's visual identity. All chart elements are fully editable in PowerPoint, allowing you to input your own data, adjust percentages, and customize colors instantly. Perfect for quarterly reports, portfolio analysis, and executive presentations requiring clear ratio visualization.
Usage Points
-
Main Usage
Visualizes proportional relationships such as market share, sales distribution, customer composition, and budget allocation. The 3-segment pie chart clearly shows how different components contribute to the whole, while the accompanying text box allows you to explain the significance and strategic implications of each segment.
-
How to Use
Double-click each pie segment in PowerPoint to input your numerical data. Update the legend and data labels to match your analysis. Modify the right-side text box with your interpretation and conclusions. Choose between two color themes (beige or blue) to align with your overall presentation design and corporate branding.
-
Recommended For
Marketing professionals analyzing market share and competitive positioning, finance teams explaining budget distribution and cost allocation, sales departments presenting customer portfolio composition, and executives delivering quarterly performance reports. Ideal for product category sales analysis, regional market breakdown, business unit revenue contribution, and customer segment profiling.
-
Slide Structure
2-slide set with consistent layout: header area (title and subtitle), left-aligned 3-segment pie chart with numerical labels on each segment, and right-side text box for detailed explanation. Optimized for 16:9 widescreen format. All elements including chart segments, labels, and text boxes are fully editable shapes.
Related Products
-

Sugar Type Analysis Pie Chart
#Product/Service Introduction #Market and Competitor Analysis #Graph
-

Business Analysis Pie Chart
#Product/Service Introduction #Market and Competitor Analysis #Graph
-

Space Industry Analysis Circular Graph
#Product/Service Introduction #Market and Competitor Analysis #Diagram
-

Oriental Medicine Component Circle Graph – Accurate Visualization of Market and Products
#Product/Service Introduction #Market and Competitor Analysis #Graph
