Data Security History Diagram
RJ0400056_7
- Last Update 06/02/2025
- File Size 0.2MB
- # of Slides 2
- File Format PPTX
- Slide Ratio 16:9
- Color
Keywords
About the Product
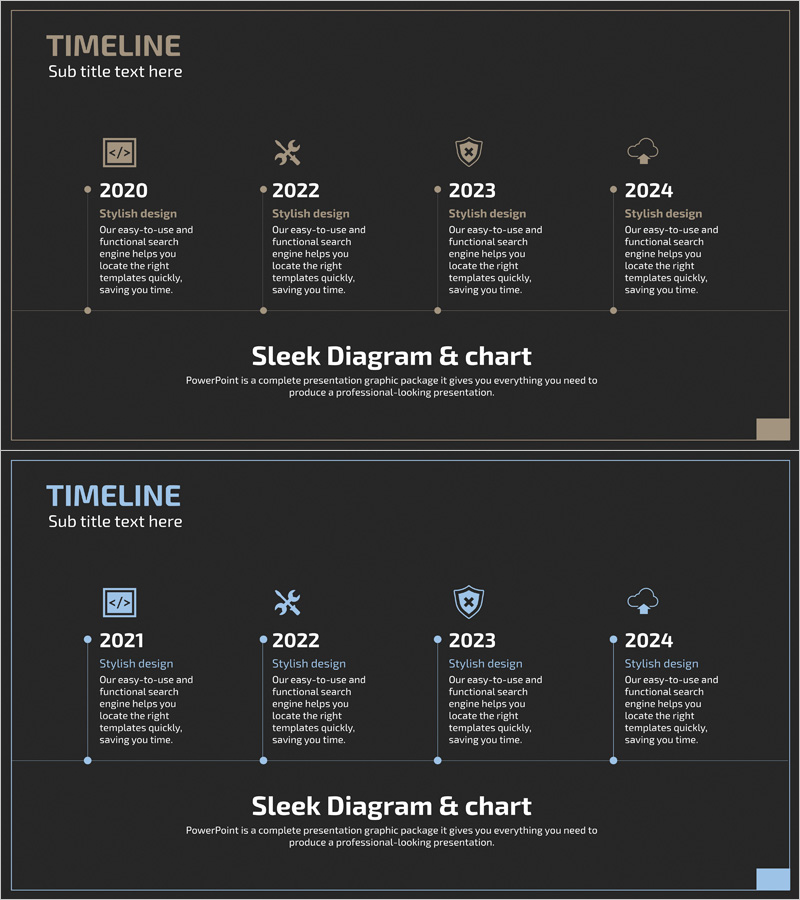
A timeline diagram PowerPoint slide connecting four years with icons and descriptive text. Designed with a dark background and beige and light blue accent colors, each milestone features distinct icons (code, wrench, security, cloud) representing different phases. Perfect for visualizing data security evolution, technology development roadmaps, project milestones, and organizational growth timelines in presentations. The 2-slide set offers multiple background color options, with fully editable text and icon elements for customization.
Usage Points
-
Main Usage
Designed to visualize key events, technological advancements, and project phases chronologically. The combination of icons and text at each stage enables intuitive communication of complex timelines, applicable to data security evolution, IT technology development, organizational growth, and product development narratives.
-
How to Use
Enter key events or achievements in the text area below each year, and replace icons with alternative images as needed. Customize background colors and accent colors to match your presentation theme. Utilize both slides to present different design variations or alternative timeline scenarios.
-
Recommended For
Ideal for IT and cybersecurity companies presenting technology evolution, startups explaining growth trajectories, product development roadmap presentations, organizational transformation narratives, and academic research progress timelines. Suitable for executive reports, investor pitch decks, technical seminars, and corporate overview presentations.
-
Slide Structure
Four nodes (2020, 2022, 2023, 2024) connected by dotted lines, with each node featuring an icon above, year label, and descriptive text below. Slide 1 features a dark gray background while Slide 2 offers a light background option for presentation environment flexibility.
Related Products
-

History Folder Shape Diagram - Optimized for Company Introduction
#Company Introduction #Product/Service Introduction #Diagram
-

Introduction to the History of the Architectural Company – A Visual Timeline
#Company Introduction #Diagram #Company Overview
-

History Overlay Diagram – Company Introduction Slide
#Company Introduction #Diagram #History
-

History Road Diagram – A Cluster Diagram Ideal for Company Introduction
#Company Introduction #Diagram #History
