
Space Exploration Presentation – Visually Captivating Design
J0400022
- Last Update 12/31/2024
- File Size 8.9MB
- # of Slides 20
- File Format PPTX
- Slide Ratio 16:9
- Color
Slide Preview


Keywords
About the Product
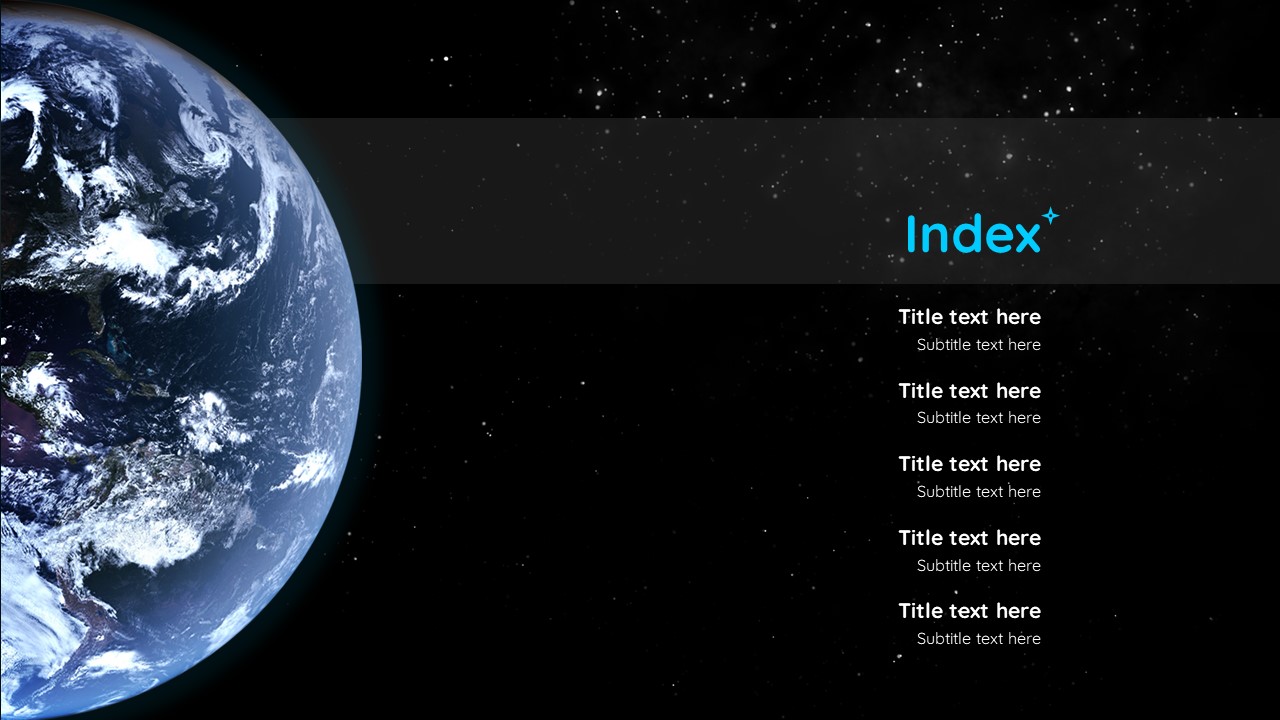
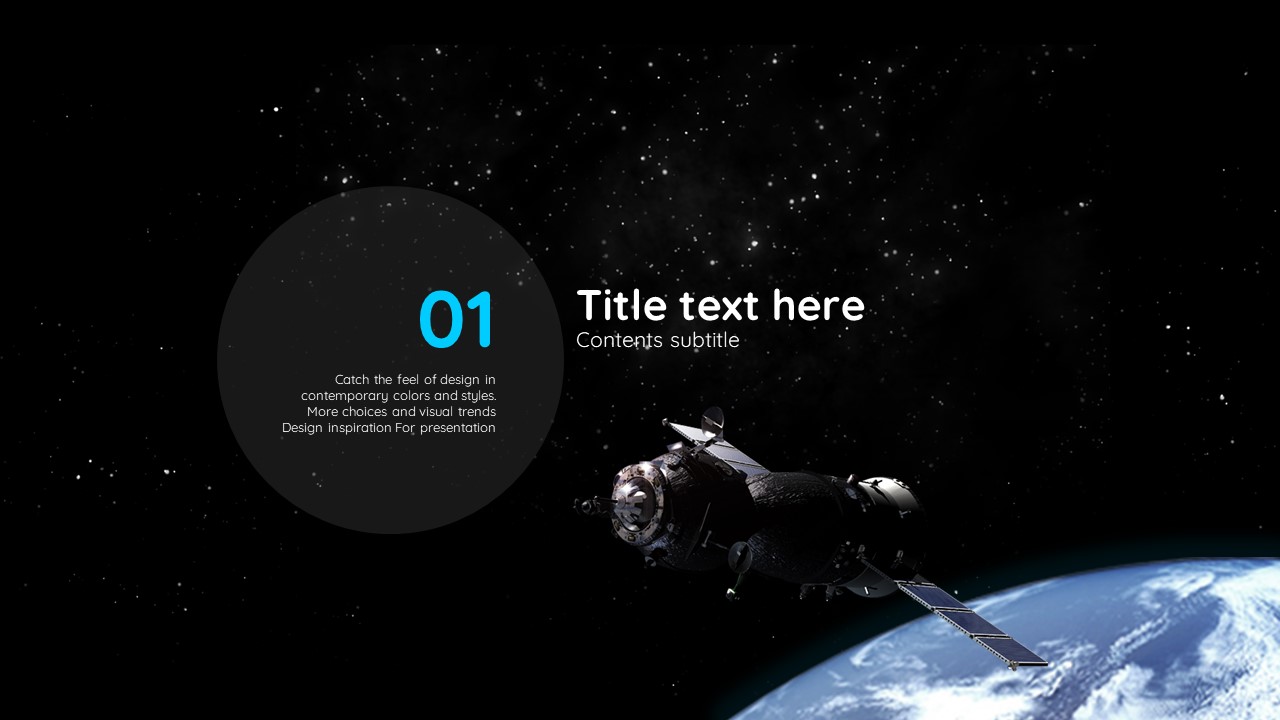
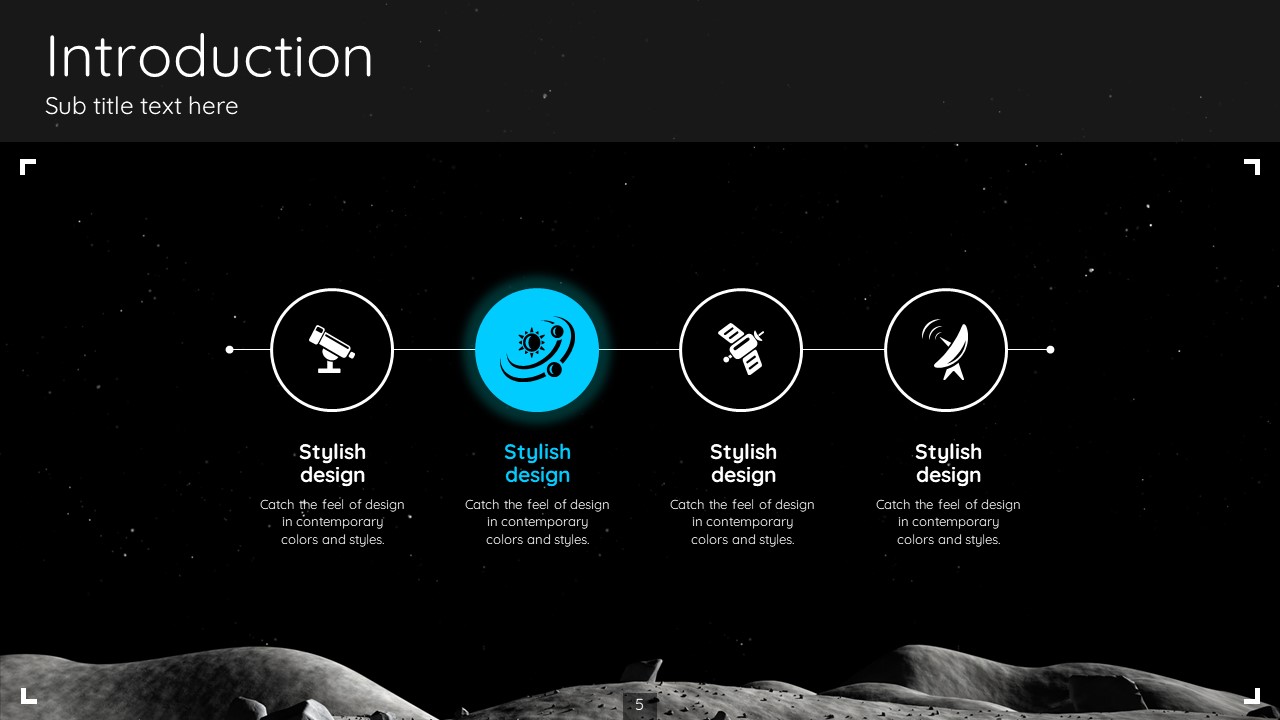
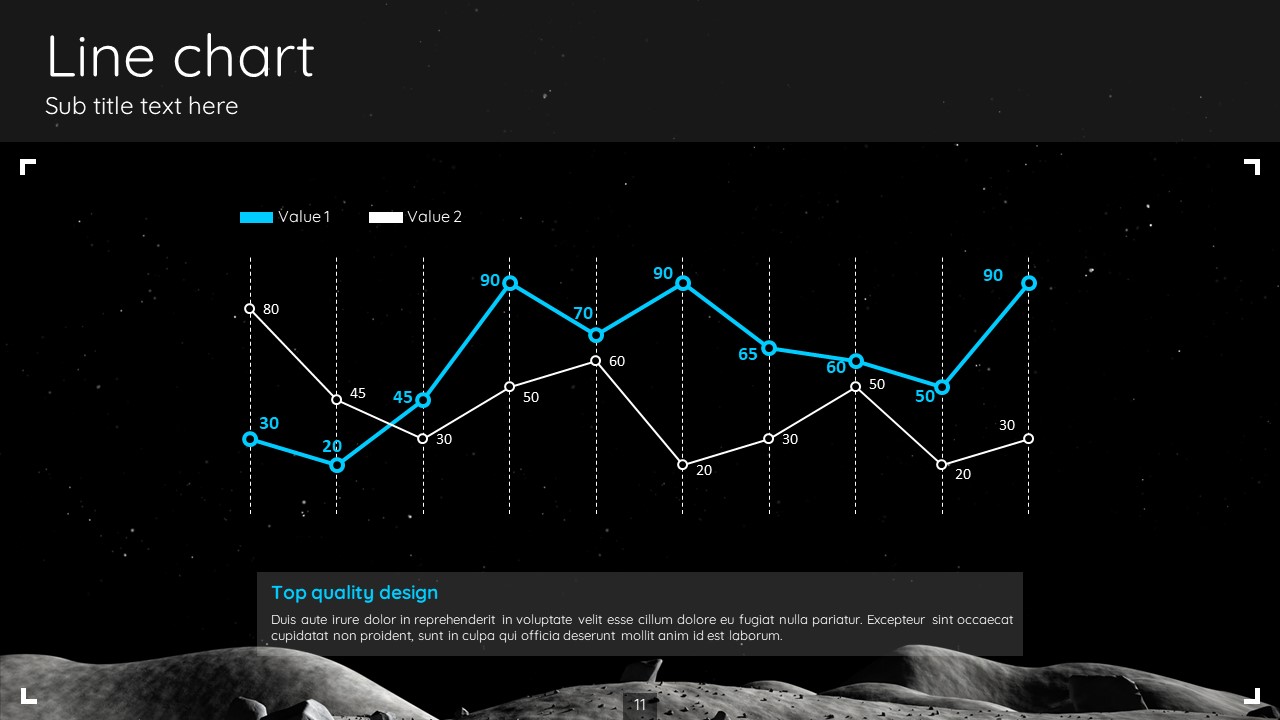
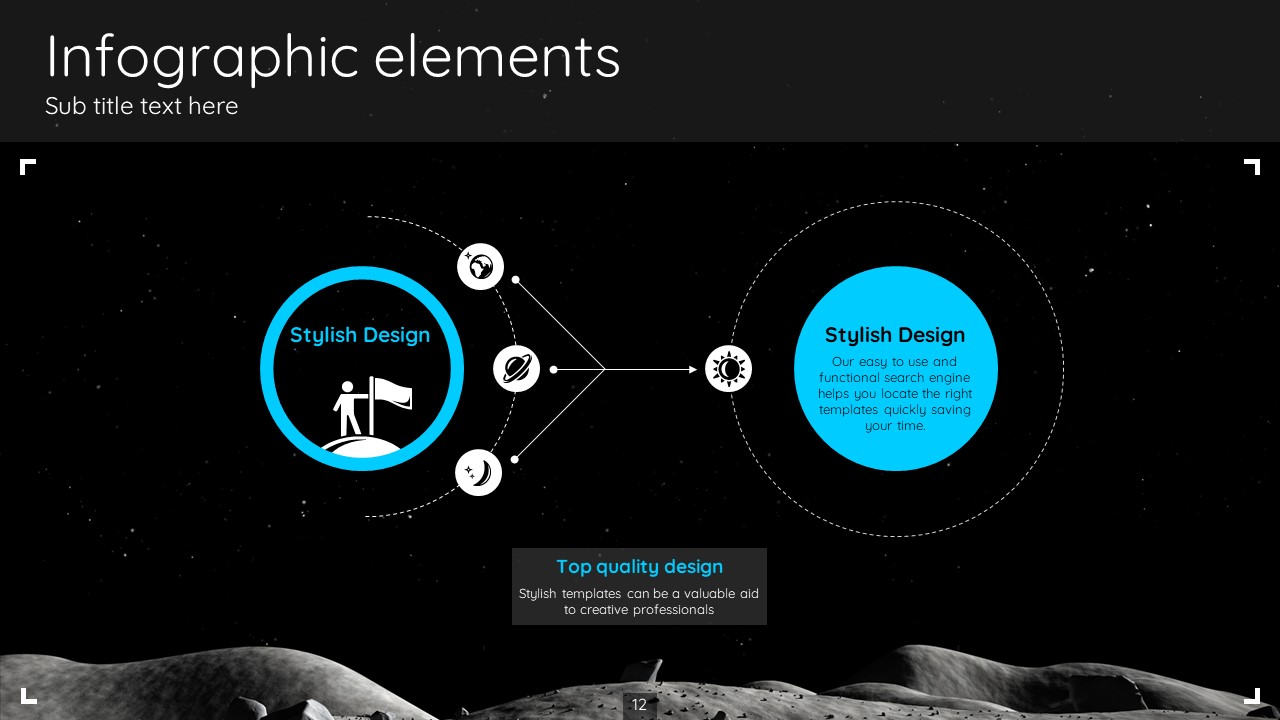
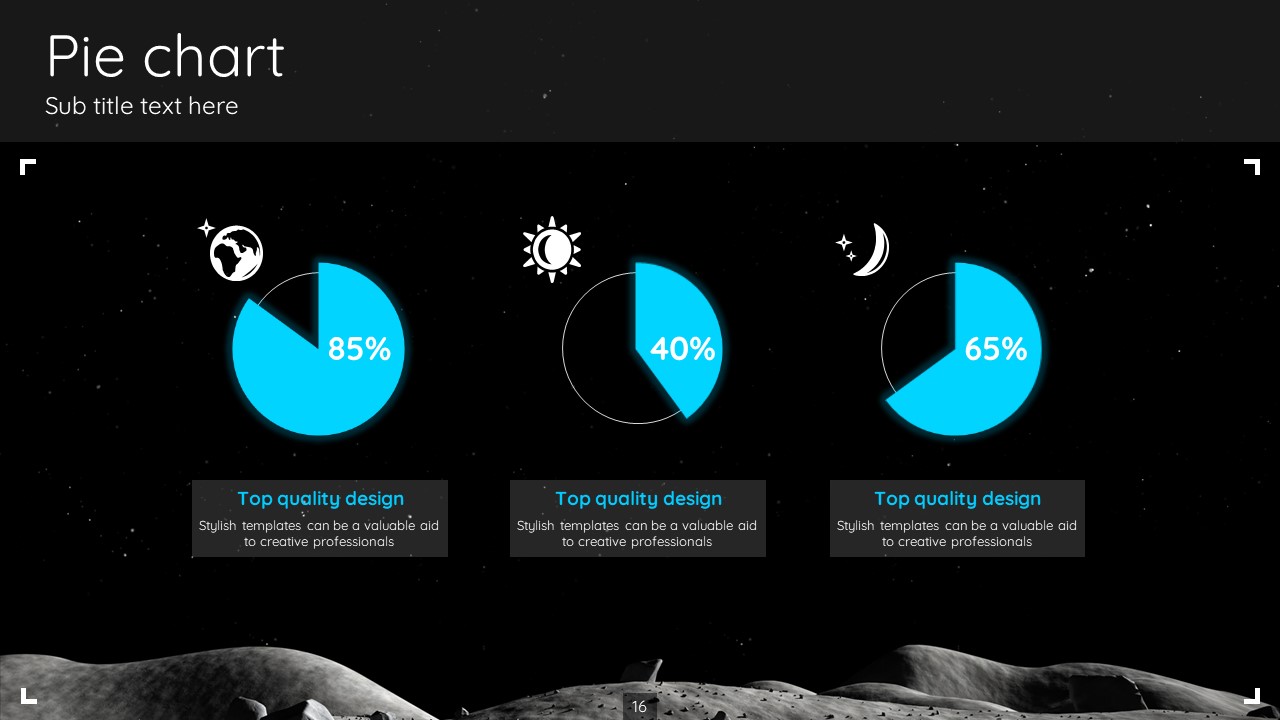
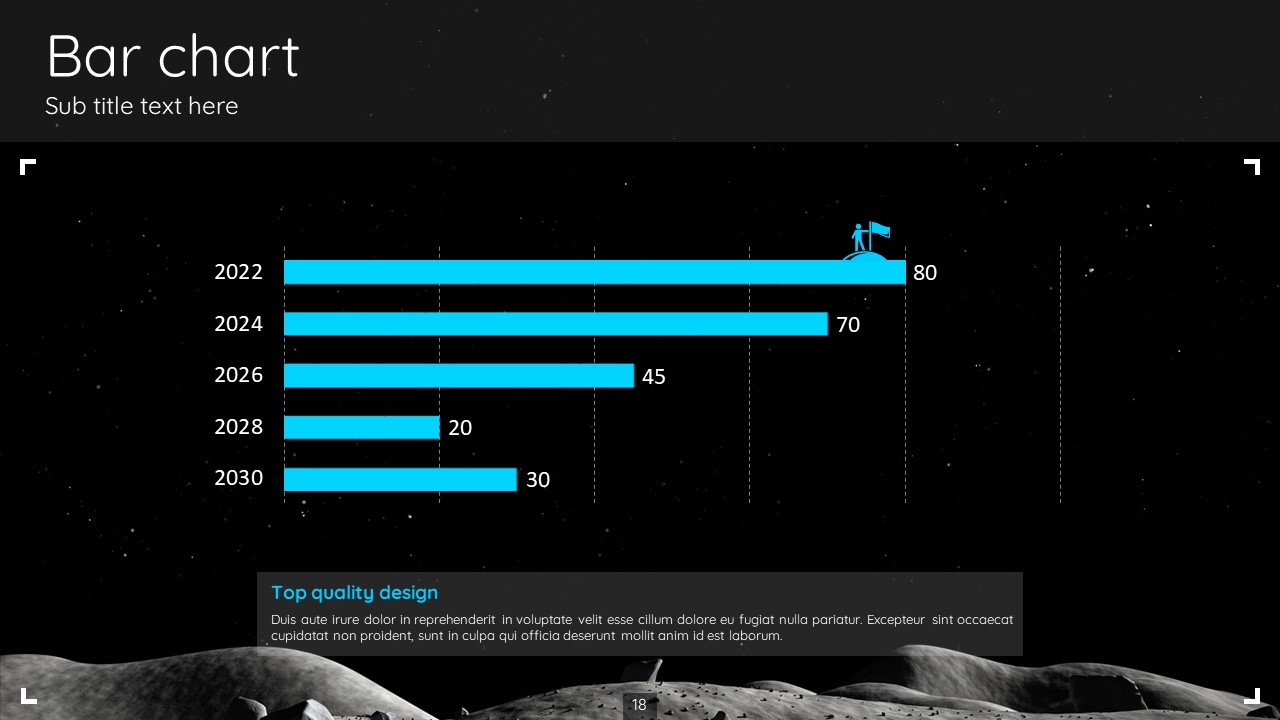
This dark-themed PowerPoint template features a full-bleed astronaut and lunar surface photograph as the cover, set against a deep black and dark gray background with consistent cyan blue accent colors applied across charts, icons, and infographic elements. The design delivers a strong sense of immersion ideal for space science and aerospace presentations. The 20-slide deck includes a variety of data visualization layouts: a cover slide, icon-based introduction, donut chart infographics, a cyan blue global map, a radar chart, a dual-series line chart, and circular connection diagrams. All slides are fully editable in PPTX format, allowing you to replace text, data, and images to suit your specific presentation needs. Optimized for 16:9 widescreen displays, this presentation template is ready to use for space exploration research, science conferences, and aerospace industry briefings.
Usage Points
-
Main Usage
Designed for space exploration, aerospace, and science research presentations, this dark-themed PowerPoint template helps researchers, students, and industry professionals deliver visually compelling slide decks at conferences, seminars, and project briefings.
-
How to Use
Open the PPTX file and replace the cover title and slogan with your own content. Update text and chart data in each slide to match your presentation. The cyan blue accent color can be changed globally via the theme color settings in PowerPoint.
-
Recommended For
Recommended for aerospace researchers, science graduate students, space-related startup founders, science educators, and anyone who needs to present space exploration or scientific research topics to an academic or professional audience.
-
Slide Structure
20 slides total: full-bleed astronaut cover, 4-icon horizontal introduction, donut chart infographic (×2), cyan blue world map, radar chart, dual-series line chart (Value 1 & 2), and circular arrow connection diagram with infographic elements.
Related Products
-

Astronomy Presentation Template – Stylish Design for Exploring the Universe
#Science/Medical
-

Science Experiment Presentation Template – Creative Visual and Design
#Science/Medical
-

Chemistry Lab Presentation Template - Eye-Catching Visual Design
#Science/Medical
-

Plastic Surgery Presentation Template – Professional Visual Representation
#Science/Medical
