Space Exploration Theme Broken Line Graph – Market and Competitor Analysis
RJ0400022_10
- Last Update 05/23/2025
- File Size 0.6MB
- # of Slides 2
- File Format PPTX
- Slide Ratio 16:9
- Color
Keywords
About the Product
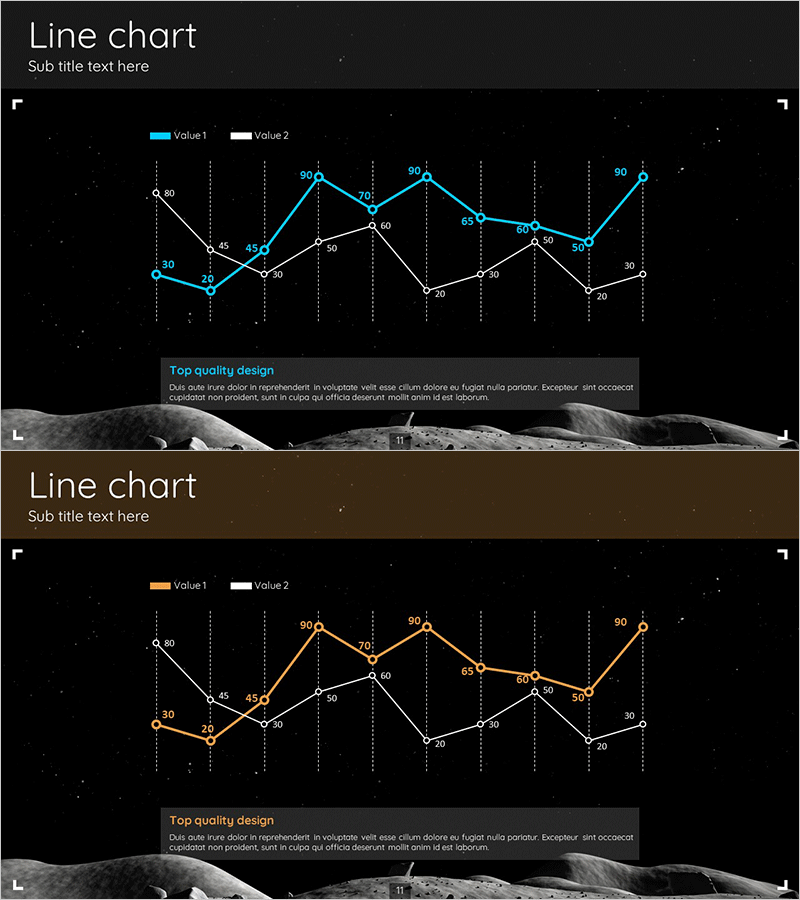
A PowerPoint slide featuring a dual-series line chart with cyan and orange lines on a dark space exploration background. The chart displays 10 data points per series with vertical gridlines and labeled values, ideal for comparing market trends and competitor performance. Each slide includes title, legend, and descriptive text areas for comprehensive data presentation. Available in 16:9 PPTX format, fully editable for immediate use in business presentations.
Usage Points
-
Main Usage
Designed to compare two or more metrics over time, such as market trends, competitor performance, or revenue progression. The line format clearly shows directional changes and volatility, while numeric labels emphasize precise data points for analytical presentations.
-
How to Use
Use in business reports, investor presentations, and marketing strategy meetings to compare quarterly or monthly performance. Distinguish series using the legend, and input actual data values at each point to reflect real analysis results. The space theme background suits technology and innovation sector presentations.
-
Recommended For
Executives, marketing teams, sales departments, and finance teams presenting quarterly results, market analysis, and competitive strategy. Particularly effective for IT, aerospace, and scientific industry performance comparisons.
-
Slide Structure
Two-slide set. Each slide contains title area, legend (Value1, Value2), vertical gridline background, two connected line series with 10 data points each, numeric labels, and descriptive text box at bottom. Cyan and orange color differentiation ensures clear series distinction.
Related Products
-

Competitor Progress Comparison Analysis Graph – Essential Tool for Market Analysis
#Market and Competitor Analysis #Graph #Competitor Analysis
-

Blue Green Broken Line Graph – Optimized for Competitor Analysis Design
#Market and Competitor Analysis #Graph #Competitor Analysis
-

Line Graph Analysis Slide – Analyze the Market with Blue and Navy
#Market and Competitor Analysis #Graph #Competitor Analysis
-

Competitor Analysis Broken Line Graph
#Market and Competitor Analysis #Graph #Competitor Analysis
