Space Exploration Theme Radial Graph & Table – Perfect Choice for Data Analysis
RJ0400022_18
- Last Update 05/23/2025
- File Size 0.5MB
- # of Slides 2
- File Format PPTX
- Slide Ratio 16:9
- Color
Keywords
- #Content-Based Slides
- #Design-Based Slides
- #Technical Approach
- #Diagram
- #Graph
- #Service Architecture Diagram
- #Table
- #Other
- #Standard Table
- #Radar Chart Spider Chart
- #16:9
- #radial chart PowerPoint
- #radar chart slide template
- #8-axis data visualization
- #multi-variable comparison slide
- #performance evaluation PPT
About the Product
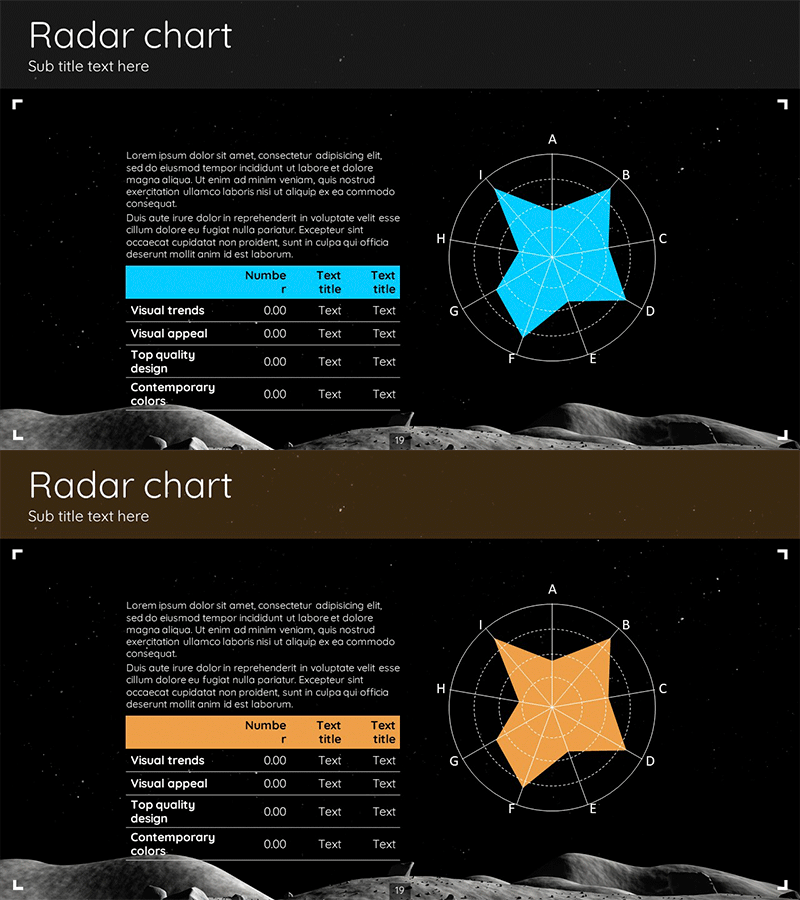
A space-themed dark background radial chart PowerPoint slide with 8 axes for comprehensive data visualization. Two color versions—cyan blue and orange—are included, each with an accompanying data table for analysis. Perfect for comparing multiple variables, evaluating performance metrics, and assessing competencies across different dimensions. The 16:9 widescreen format includes 2 fully editable slides, ideal for technical presentations, scientific reports, and data-driven business proposals.
Usage Points
-
Main Usage
Simultaneously compare multiple variables, performance indicators, and characteristics across different dimensions. Ideal for technology specifications, organizational capability assessments, product feature analysis, and competitive benchmarking. The radial format intuitively highlights strengths and weaknesses across all measured factors.
-
How to Use
Enter evaluation criteria labels on each axis and input corresponding values—the shape automatically adjusts. Populate the data table with numerical information to synchronize with the chart. Choose between cyan or orange versions based on your presentation theme and corporate branding.
-
Recommended For
Technology, IT, science, and data analytics presentations. Recommended for product performance comparisons, technical capability evaluations, organizational diagnostics, market analysis reports, investor pitch decks, academic presentations, and consulting proposals requiring multi-dimensional data representation.
-
Slide Structure
8-axis radial chart with integrated data input table. Each axis labeled A through H with concentric grid lines for easy value reading. Left section contains descriptive text, center-right displays the radial chart, and bottom features a 4-row data table for numerical input and reference.
Related Products
-

Abstract Pattern Presentation Radar Chart – Emphasizing Marketing Strategy
#Marketing Plan and Strategy #Financial Plans and Performance #Diagram
-

Radar Charts and Tables – Market Analysis and Comparison
#Product/Service Introduction #Market and Competitor Analysis #Diagram
-

Market Segmentation Analysis Radial Graph – Reliable Data Visualization
#Business Introduction #Market and Competitor Analysis #Diagram
-

Camping Competitor Characteristic Analysis Pentagon Graph
#Market and Competitor Analysis #Diagram #Graph
