Space Exploration Goal Connection Diagram – Business Vision and Strategy
RJ0400022_11
- Last Update 05/23/2025
- File Size 0.6MB
- # of Slides 2
- File Format PPTX
- Slide Ratio 16:9
- Color
Keywords
- #Content-Based Slides
- #Design-Based Slides
- #Business Vision and Strategy
- #Diagram
- #Business Goals
- #Cluster
- #Chain Diagram
- #16:9
- #connection diagram PowerPoint
- #radial diagram slide template
- #business goal visualization
- #3-node diagram
- #strategy presentation slide
- #how to create connection diagram in PowerPoint
About the Product
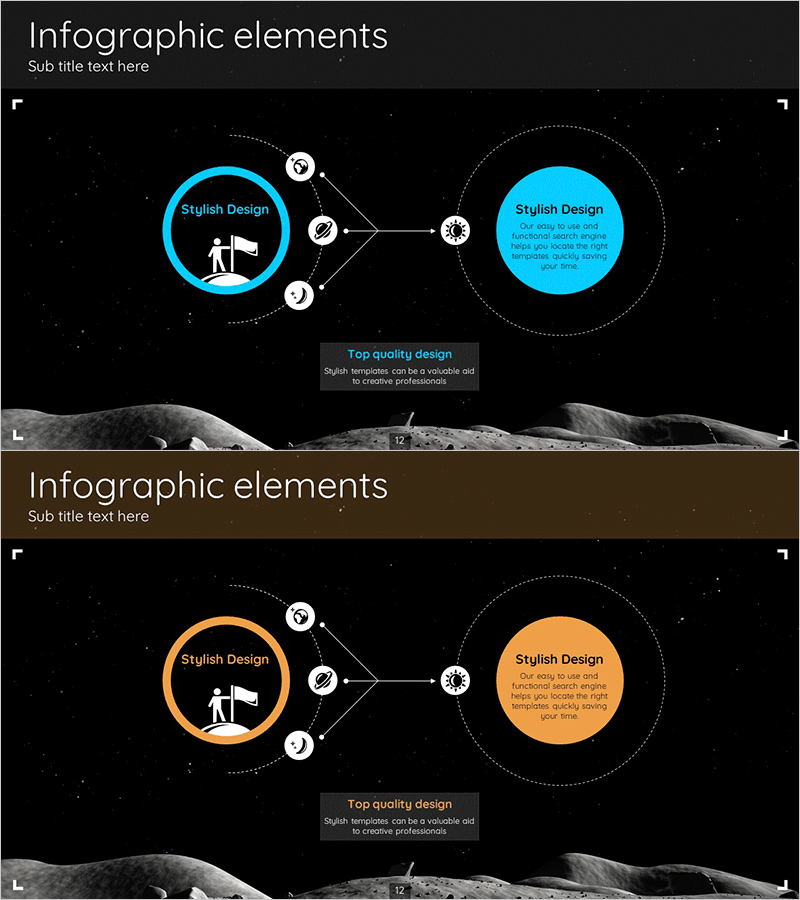
A 3-node radial connection diagram PowerPoint slide that visualizes business vision and strategy. The central core objective branches outward to left-side execution strategy and right-side performance targets through dotted connectors and numbered icons, clearly expressing step-by-step relationships. Black background combined with bright cyan circular nodes and white typography ensures high-contrast readability, while the lunar surface imagery reinforces the space theme. Two-slide set provides both cyan and orange color versions for flexible presentation adaptation.
Usage Points
-
Main Usage
Clearly expresses relationships flowing from a central core objective to execution strategies and performance targets. Effectively simplifies complex relationships in business plans, strategic presentations, and organizational goal-sharing sessions through intuitive visual representation.
-
How to Use
Enter core objective in the center circular node, execution strategy on the left, and performance metrics on the right. Dotted connectors and numbered icons represent sequential processes or priorities. Double-click text boxes to edit content and adjust colors to match corporate branding guidelines.
-
Recommended For
Ideal for executives, strategic planning teams, business development managers, and consultants presenting management strategy, business plans, and organizational objectives. Particularly effective when emphasizing the linkage between goals and implementation approaches.
-
Slide Structure
Two-slide set. Each slide features one central circular node with one node on each side (three nodes total), connected by dotted lines with numbered circular icons (1, 2, 3) indicating relationships. First slide uses cyan color scheme; second slide features orange version for color flexibility.
Related Products
-

Business Vision and Goals Slide – Cluster Diagram
#Business Vision and Strategy #Diagram #Business Vision
-

Global Warming Solution Presentation Template
#Product/Service Introduction #Business Vision and Strategy #Diagram
-

Geometry Wide PPT Diagram – Business Strategy and Goals
#Business Vision and Strategy #Diagram #Business Strategy
-

Triangular Pattern Presentation Template Diagram – Effective Visualization of Business Strategy
#Product/Service Introduction #Business Vision and Strategy #Diagram
