Space Exploration Donut Pie Chart
RJ0400022_14
- Last Update 05/23/2025
- File Size 0.6MB
- # of Slides 2
- File Format PPTX
- Slide Ratio 16:9
- Color
Keywords
- #Content-Based Slides
- #Design-Based Slides
- #Product/Service Introduction
- #Market and Competitor Analysis
- #Graph
- #Other
- #Development Status
- #Market Share
- #Circles
- #Doughnut Chart
- #16:9
- #donut pie chart PowerPoint
- #donut chart slide template
- #data visualization PowerPoint
- #percentage chart template
- #how to create donut chart in PowerPoint
About the Product
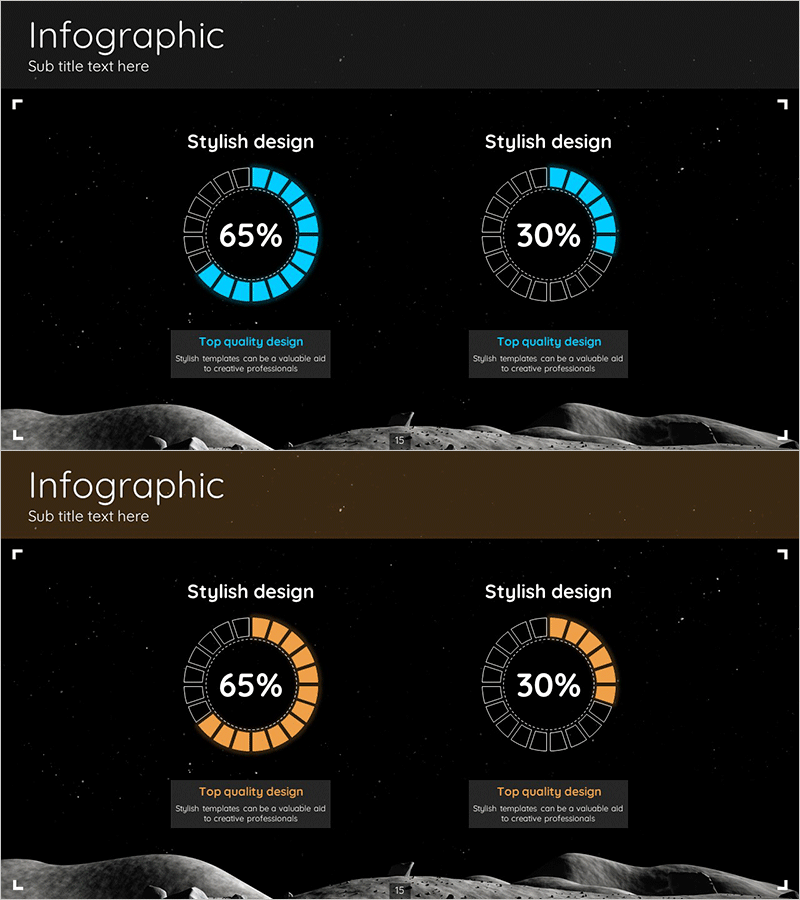
Space exploration-themed donut pie chart PowerPoint slide set featuring 2 slides with blue and orange color variations. Each slide displays percentage values in the central donut ring area and visualizes data proportions through outer ring segments. Designed with space background imagery, this presentation template is ready for immediate use in market share analysis, statistical reports, and data-driven presentations. Optimized for 16:9 widescreen format with clearly defined text and numerical input areas for easy editing and customization.
Usage Points
-
Main Usage
Ideal for presenting market share, sales distribution, budget allocation, and customer composition as proportions of a whole. The donut center emphasizes key metrics while outer ring segments intuitively convey each item's relative importance, directing audience focus to critical data points.
-
How to Use
Open the slide and replace percentage values and legend text with your own data. Select either the blue or orange color version to match your presentation theme and corporate branding. The space background works particularly well for technology, aerospace, and future-focused topics.
-
Recommended For
Technology company investor presentations, aerospace and space industry talks, data analysis reports, marketing performance reviews, financial status updates, customer segmentation analysis, executive briefings, consulting proposals, and academic presentations.
-
Slide Structure
2-slide set with identical donut chart layouts. Each slide features two donut pie charts positioned left and right, displaying percentages (65%, 30%) in the center with 12 outer ring segments for detailed data representation. Bottom section includes 'Top quality design' caption and descriptive text area for additional context.
Related Products
-

Charge Shape Circle Graph for Visualizing Data Analysis – Effective Market and Competitor Analysis
#Product/Service Introduction #Market and Competitor Analysis #Graph
-

Donut Chart Slide for Major Cultivation Countries
#Product/Service Introduction #Market and Competitor Analysis #Graph
-

Aerospace Industry Progress Status Graph – Analysis and Vision Presentation
#Product/Service Introduction #Market and Competitor Analysis #Graph
-

Market Share and Usage Status by Application – Statistical Analysis
#Market and Competitor Analysis #Graph #Other
