Space Exploration Goal Arrow Graph – Infused with Business Strategy
RJ0400022_13
- Last Update 05/23/2025
- File Size 0.7MB
- # of Slides 2
- File Format PPTX
- Slide Ratio 16:9
- Color
Keywords
About the Product
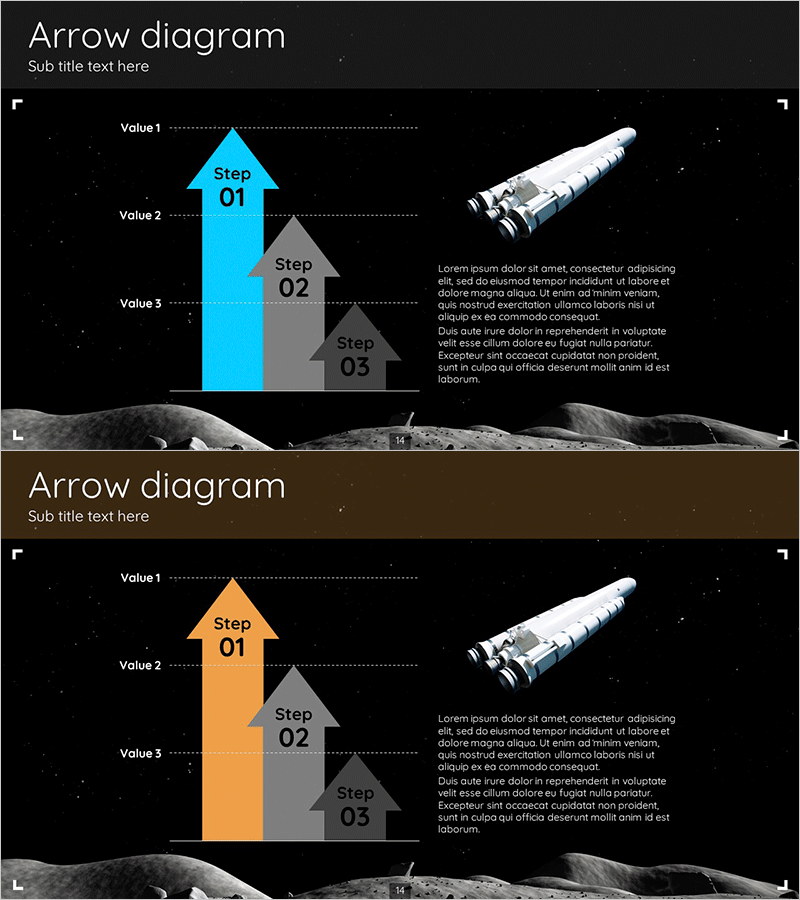
A 3-step arrow diagram PowerPoint slide that clearly visualizes business strategy and phased implementation timelines. The design features a dark background with blue and gray arrow shapes arranged vertically to represent sequential progress stages. Each step includes dedicated input areas for Value 1, 2, and 3, along with text fields for Step 01, 02, and 03, enabling effective communication of project goals, operational plans, and execution schedules. The space exploration theme with rocket imagery creates an innovative and forward-looking atmosphere. This 2-slide PPTX template is fully editable and ready to use for business presentations, strategy meetings, project kickoffs, and stakeholder updates.
Usage Points
-
Main Usage
Visualizes business strategy, project roadmaps, and phased operational plans using a 3-step arrow structure. Simultaneously displays target values and execution items for each stage, effectively communicating decision-making rationale and implementation plans to stakeholders.
-
How to Use
Use in business presentations, strategy meetings, and project kickoff sessions to explain phased implementation processes. Input specific objectives, budgets, timelines, and responsible departments in each arrow section to enhance organizational understanding and alignment.
-
Recommended For
Ideal for business strategists, project managers, executive presenters, and marketing planners explaining phased implementation plans. Particularly effective for simplifying and visualizing complex 3+ stage processes in a clear, intuitive manner.
-
Slide Structure
Two-slide template with dark background featuring three vertically stacked arrow shapes (blue or orange) on each slide. Left section contains Value 1, 2, 3 input areas; center section displays Step 01, 02, 03 text fields; right section includes rocket imagery and descriptive text area, creating clear information hierarchy.
Related Products
-

Banking Services Layer Diagram – Business Strategy
#Business Strategy #Operational Plan #Diagram
-

Energy Business Process – Visualization of Strategic Operating Plan
#Business Strategy #Operational Plan #Diagram
-

Step by Step Silhouette Graph – Visualization for Operational Planning
#Business Management #Operational Plan #Graph
-

Customer Rating Percentage Infographic Chart for Programs
#Product/Service Introduction #Market and Competitor Analysis #Graph
