Space Business Connection Diagram
RJ0400022_4
- Last Update 05/23/2025
- File Size 0.5MB
- # of Slides 2
- File Format PPTX
- Slide Ratio 16:9
- Color
Keywords
About the Product
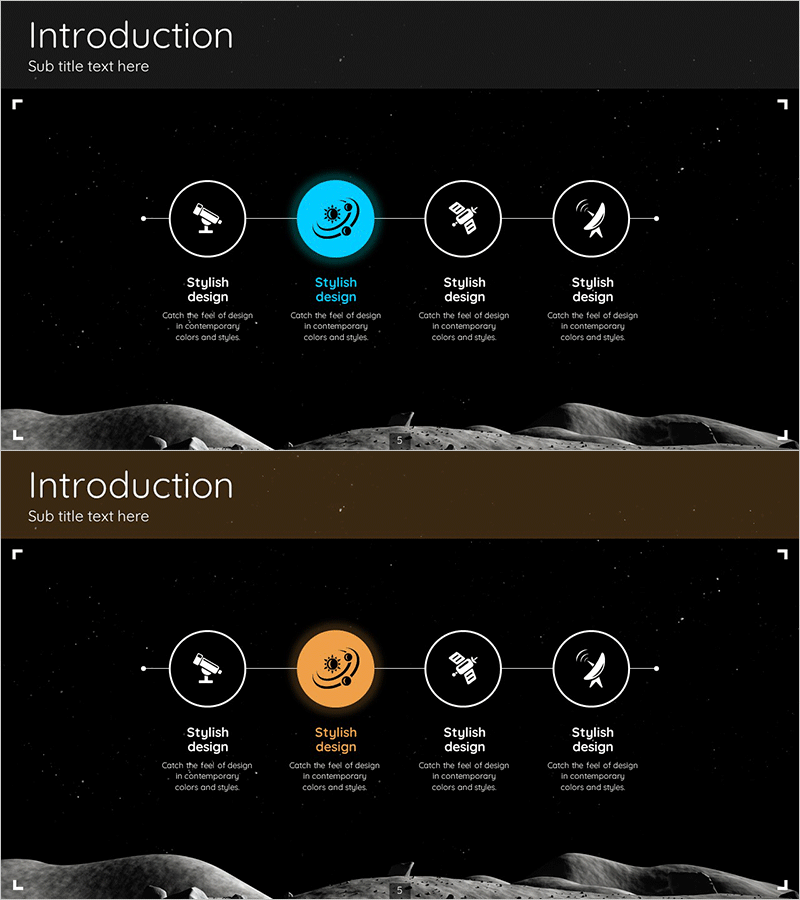
A 4-node connection diagram PowerPoint slide designed for space business market analysis and competitive landscape mapping. The linear flow structure radiates from a central highlighted node (blue or orange) to four directional endpoints, clearly illustrating relationships between core business domains and peripheral elements. Built on a black background with white icons and connecting lines, this slide deck is ideal for technology and aerospace industry presentations. The 2-slide set includes color variations (blue and orange accent options), with fully editable text fields in each node. Ready-to-use for business strategy presentations, market entry analysis, and cluster mapping in investment pitches and corporate strategy decks.
Usage Points
-
Main Usage
Visualize market structure and competitive relationships in space, satellite, and technology industries using four key elements. The radial structure from a central hub to four directional nodes intuitively communicates how core business areas connect to surrounding ecosystem players and market forces.
-
How to Use
Deploy in business strategy presentations, investment pitch decks, and market analysis reports within market overview or competitive landscape sections. Populate each node with business segments, competitors, technology domains, or customer segments to complete the relationship map. The black background ensures excellent visibility in projector environments.
-
Recommended For
Space and satellite industry professionals, technology company executives, business development managers, market analysts, and investor-facing presenters. Ideal for startup pitches, corporate new business planning, and consulting firm industry analysis deliverables.
-
Slide Structure
2-slide set. Each slide features one central highlighted node (circular, blue or orange) connected via lines to four surrounding nodes (circular, white outline). Text input areas below each node enable customization. Icons (satellite, communication, rocket, antenna) provide visual differentiation and industry context.
Related Products
-

Timeline Diagram for Business Goals and Schedule – Journey to Achieve Vision
#Company Introduction #Business Vision and Strategy #Diagram
-

Geometric Pattern Wide PPT Map – Market Analysis and Strategy Development
#Company Introduction #Marketing Plan and Strategy #Diagram
-

Global Market Entry Plan – Continuous Growth Strategy
#Company Introduction #Marketing Plan and Strategy #Diagram
-

Business Area Connection Diagram – Exploring Business Domains
#Company Introduction #Business Introduction #Diagram
