Earth Analysis Bundle Vertical Bar Graph – Market and Competitor Analysis
RJ0400022_8
- Last Update 05/23/2025
- File Size 0.9MB
- # of Slides 2
- File Format PPTX
- Slide Ratio 16:9
- Color
Keywords
- #Content-Based Slides
- #Design-Based Slides
- #Market and Competitor Analysis
- #Graph
- #Competitor Analysis
- #Market Analysis
- #Column
- #Grouped Column
- #16:9
- #clustered vertical bar chart PowerPoint
- #2-series comparison chart template
- #market analysis slide
- #competitor analysis graph
- #data visualization PPT slide
About the Product
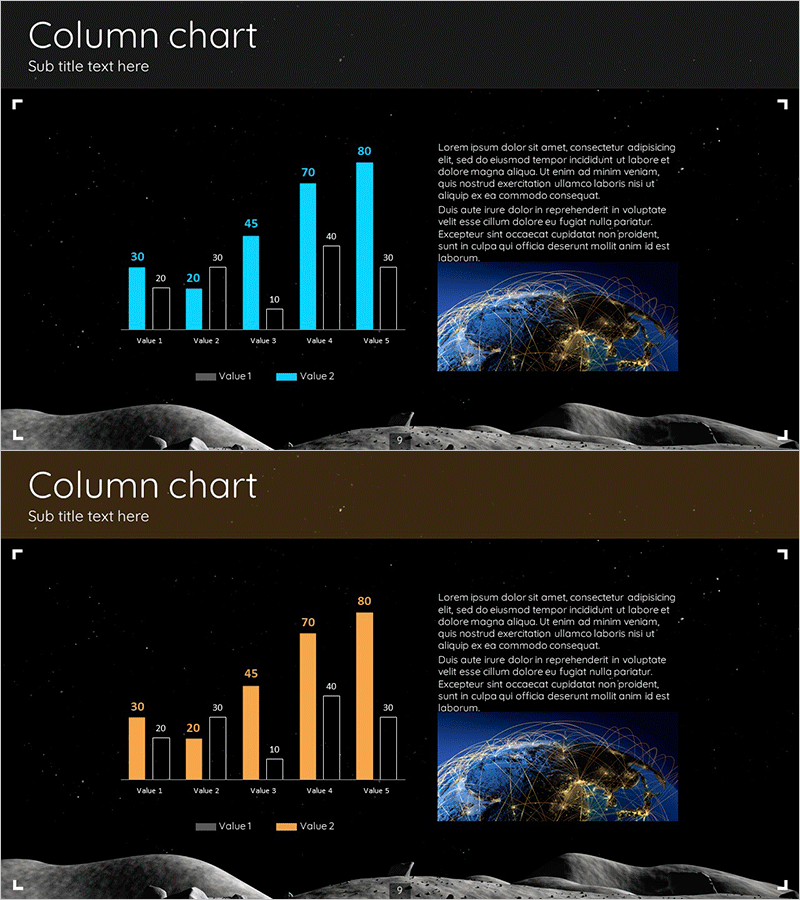
A clustered vertical bar chart PowerPoint slide featuring an earth and space theme background. This presentation template displays 5 items with 2 data series (Value 1 and Value 2) side-by-side for direct comparison. Ideal for market analysis, competitor benchmarking, and sales performance visualization. The design uses cyan and orange color schemes against a dark background, with numeric labels displayed above each bar. The right side incorporates a global network earth image with accompanying text area to emphasize international business context. Delivered in 16:9 PPTX format, fully editable and ready for immediate use.
Usage Points
-
Main Usage
Designed to compare two data series across five categories simultaneously, making it ideal for presenting market size, competitor performance, or sales channel metrics. Effectively communicates competitive positioning in investor pitch decks, business plans, and marketing strategy presentations.
-
How to Use
Input your numerical values for each item (Value 1–5) and the bar heights adjust automatically. Modify the cyan and orange color scheme to match your corporate branding or presentation theme. Customize the right-side text area with analysis findings and strategic insights to enhance data interpretation.
-
Recommended For
Strategic planning teams, marketing departments, and sales teams presenting market analysis. Suitable for executive reports, investor relations materials, competitor benchmarking analyses, and global business presentations. Particularly effective for IT, financial services, and retail industry presentations.
-
Slide Structure
2-slide set. Each slide features a clustered vertical bar chart with 5 items and 2 data series (10 bars total), title and subtitle areas at the top, a global network earth image occupying approximately 40% of the right side, and a text description area on the left. Optimized for 16:9 widescreen format in modern presentation environments.
Related Products
-

Market Analysis Bundle Vertical Bar Graph – Effective Data Visualization
#Market and Competitor Analysis #Graph #Competitor Analysis
-

Clustered Vertical Bar Graph for Market Analysis – Data Insights
#Market and Competitor Analysis #Graph #Competitor Analysis
-

Business Competitor Comparison Analysis Graph – Effective Investment and Strategy Development
#Market and Competitor Analysis #Graph #Competitor Analysis
-

Space Exploration Analysis Bar Graph
#Market and Competitor Analysis #Graph #Competitor Analysis
