
Financial Presentation Wide – Visually Appealing Design
J0300073
- Last Update 01/04/2025
- File Size 64.5MB
- # of Slides 30
- File Format PPTX
- Slide Ratio 16:9
- Color
Slide Preview


Keywords
About the Product
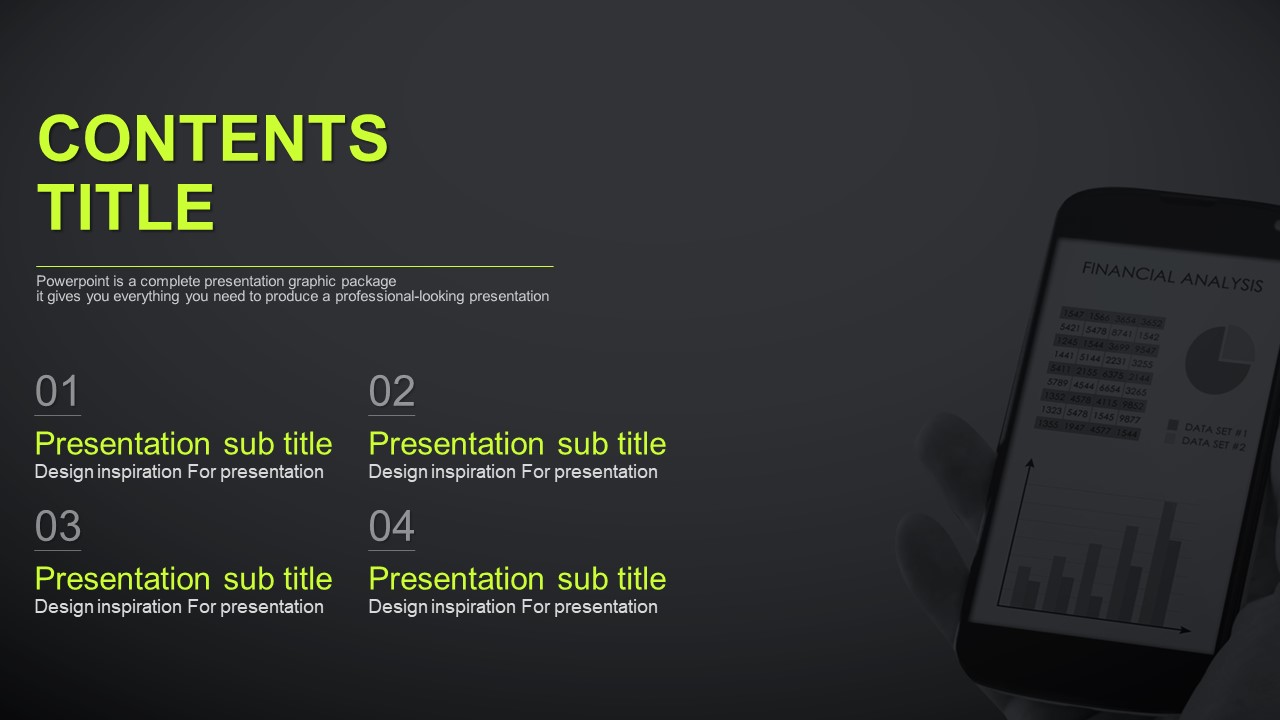
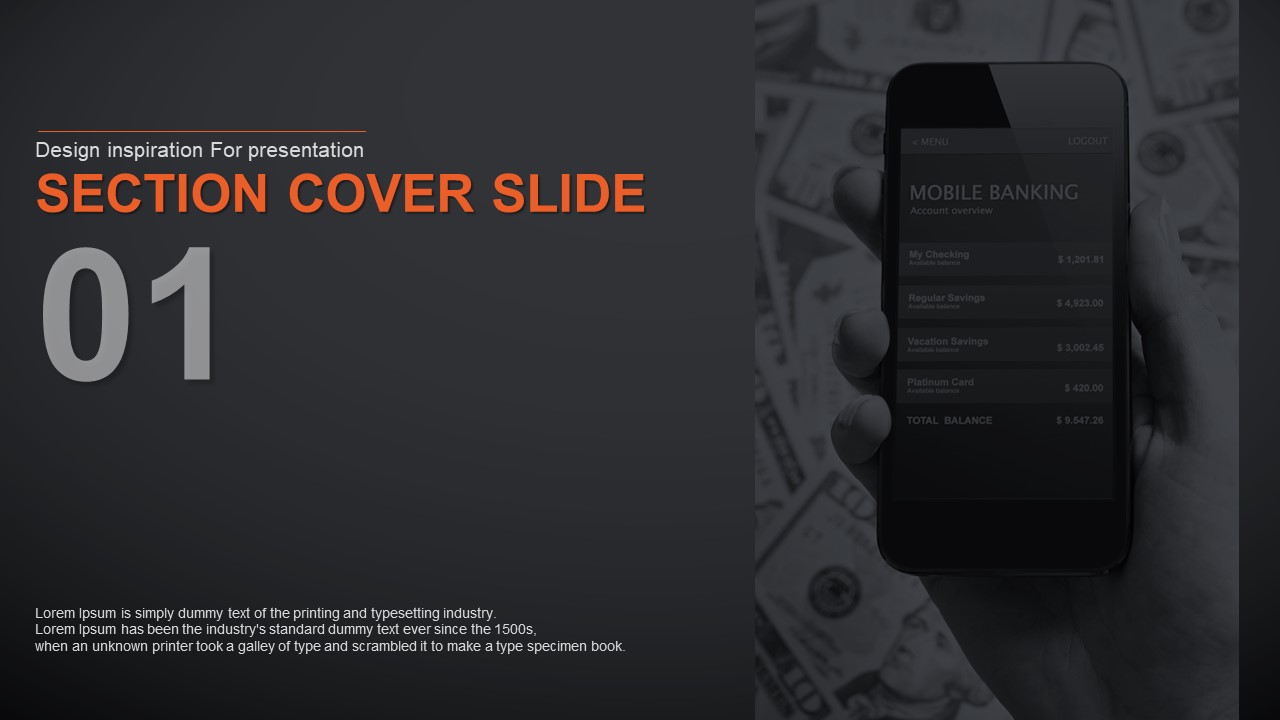
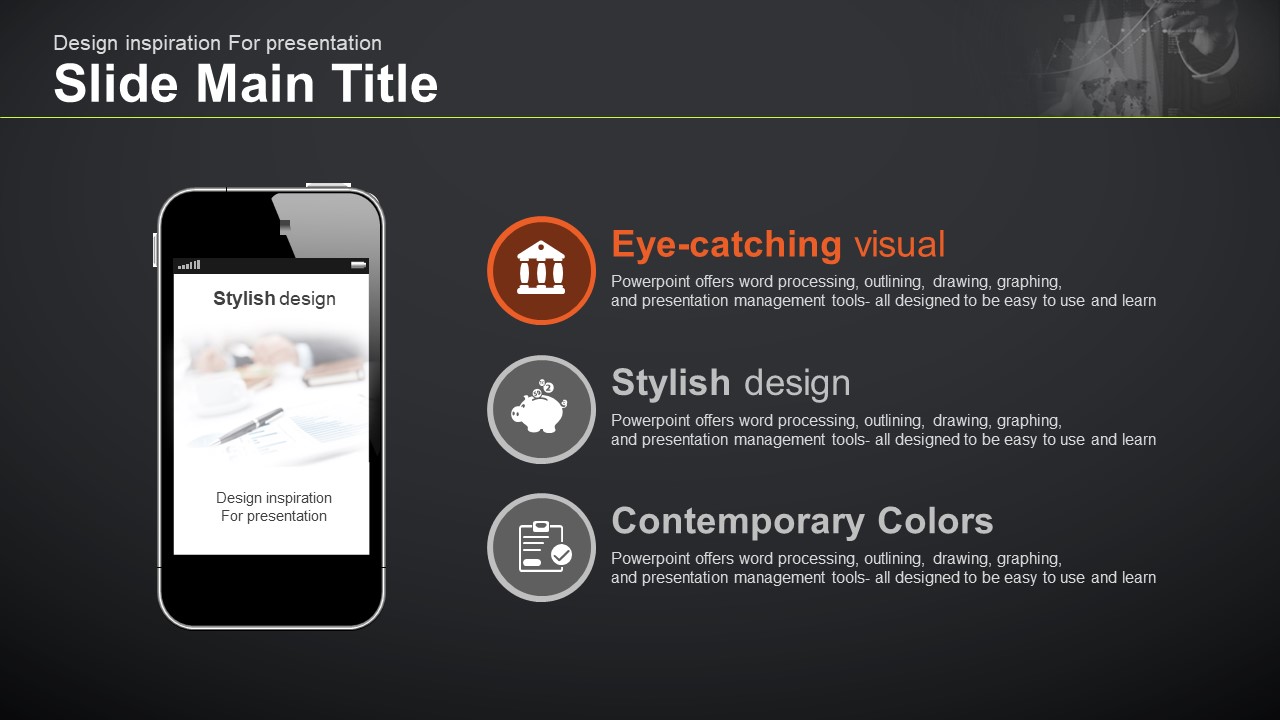
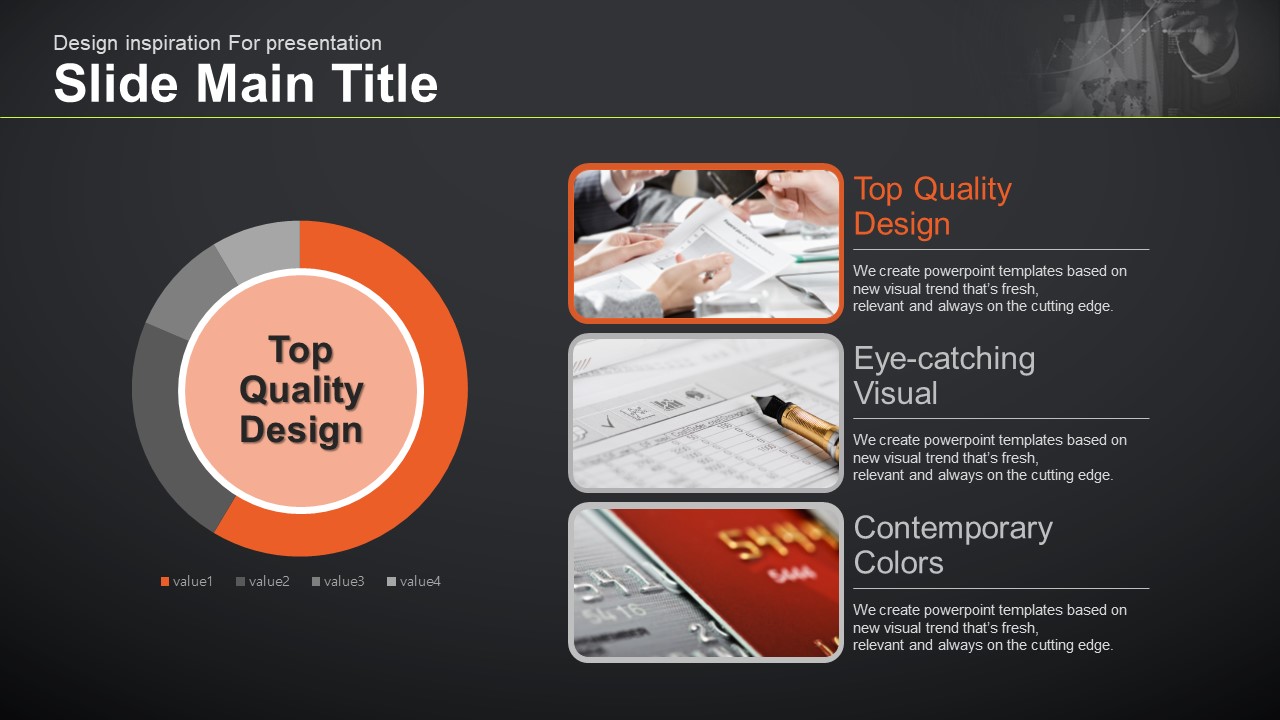
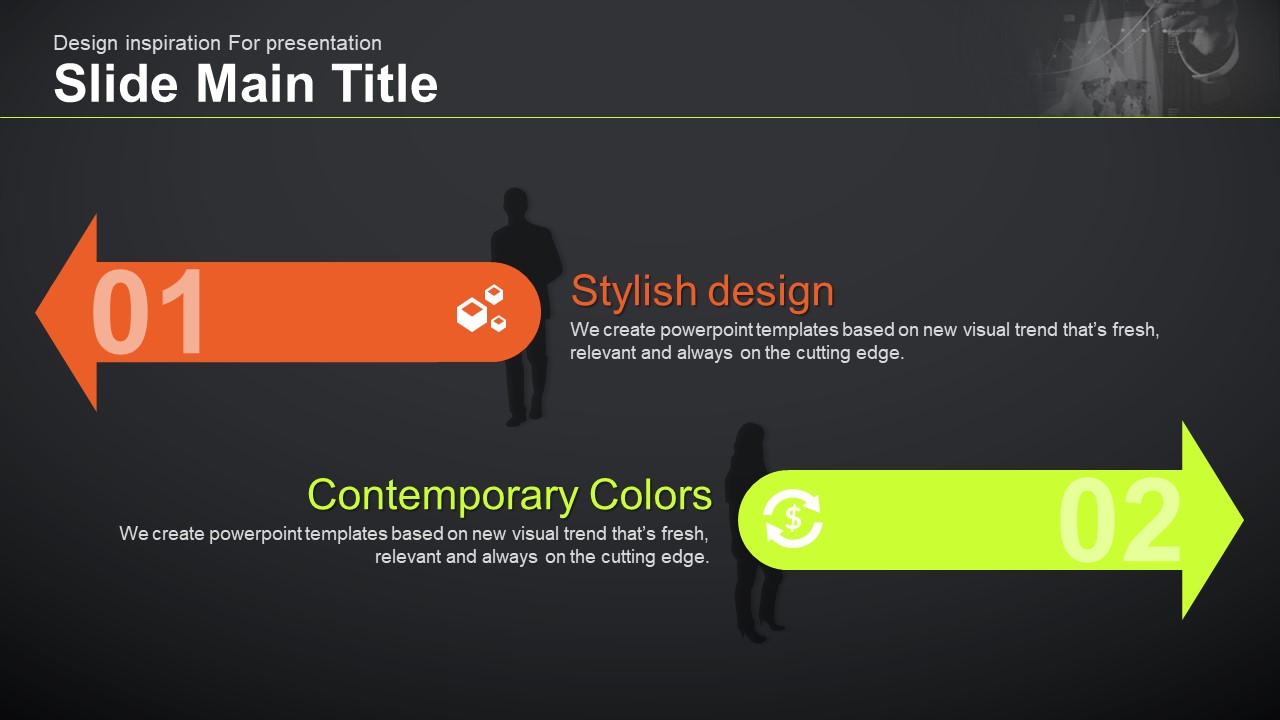
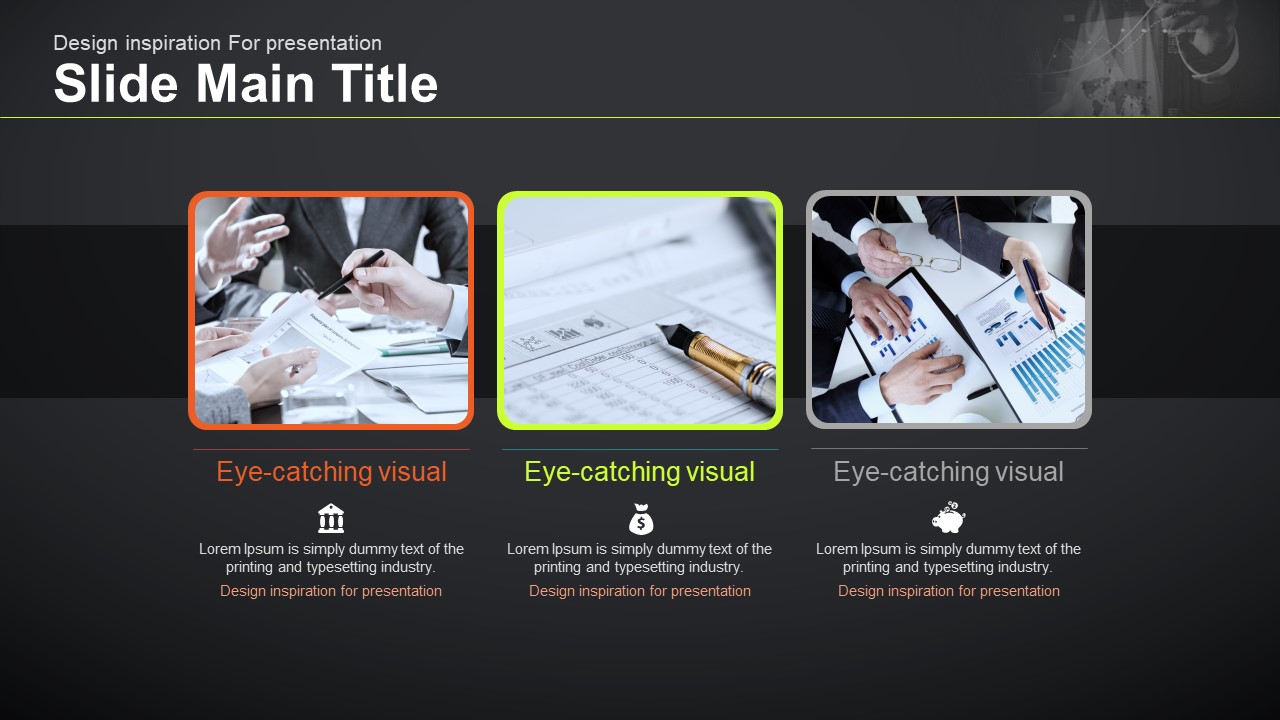
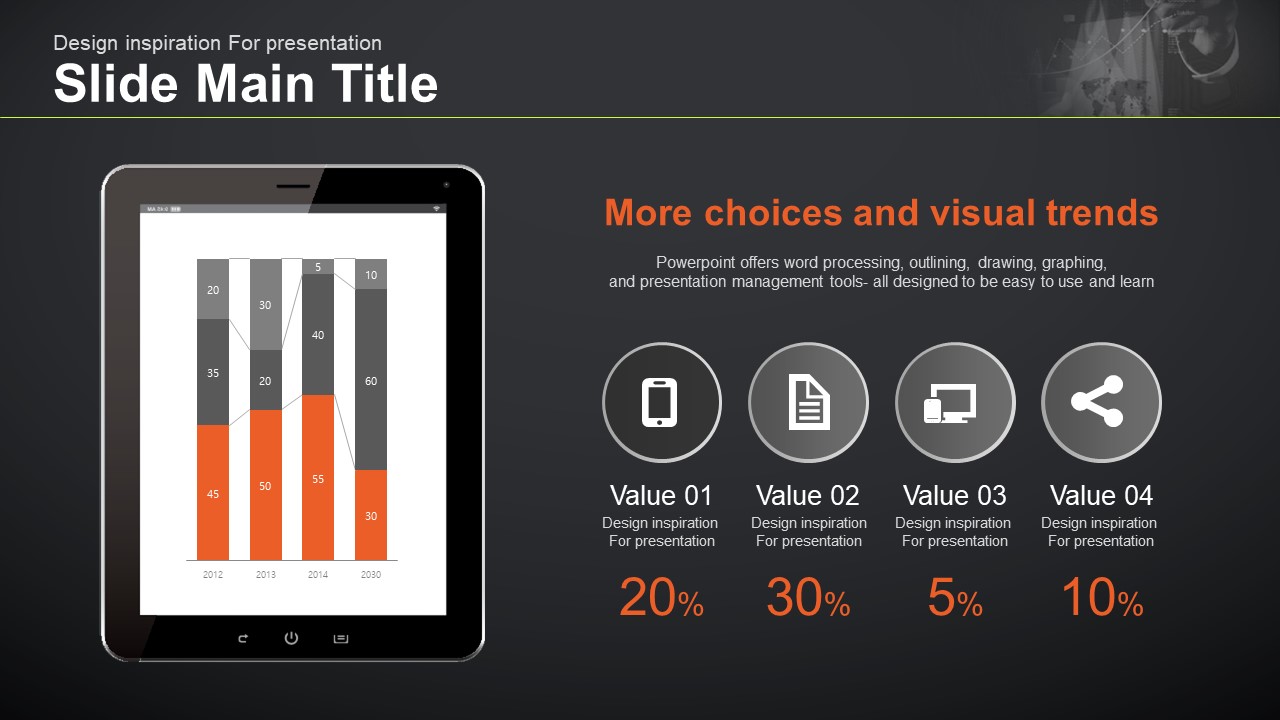
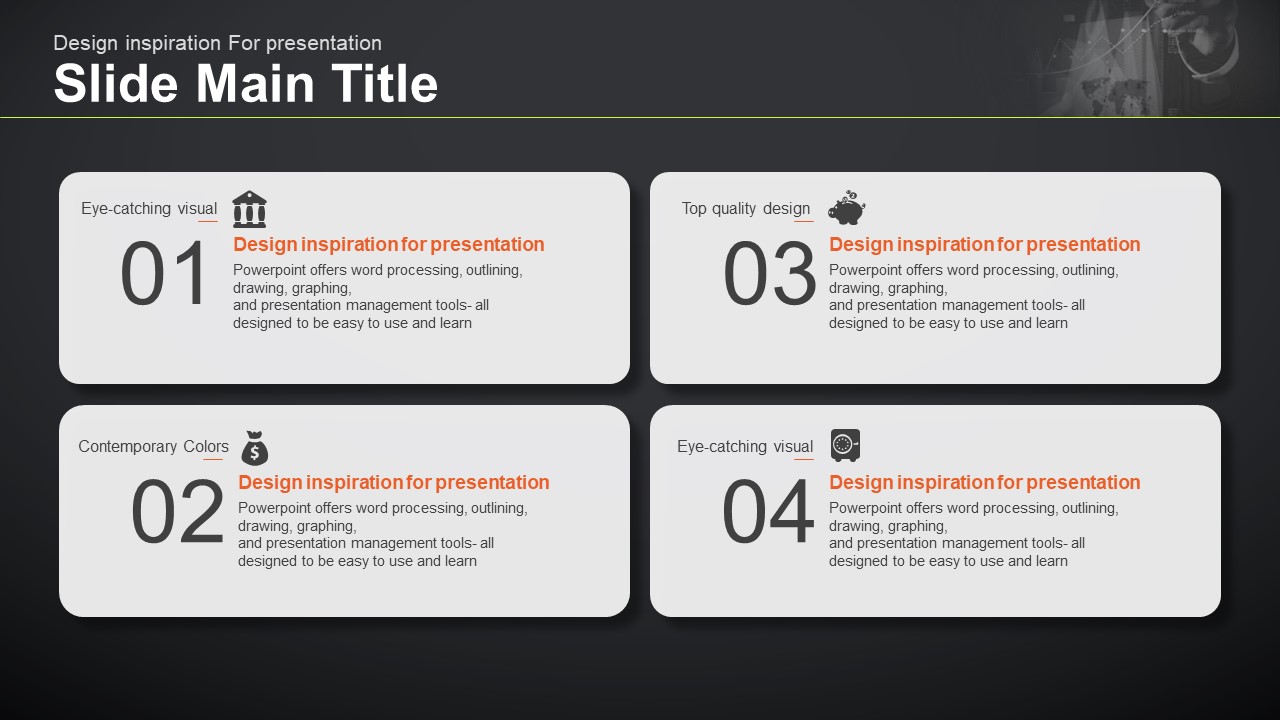
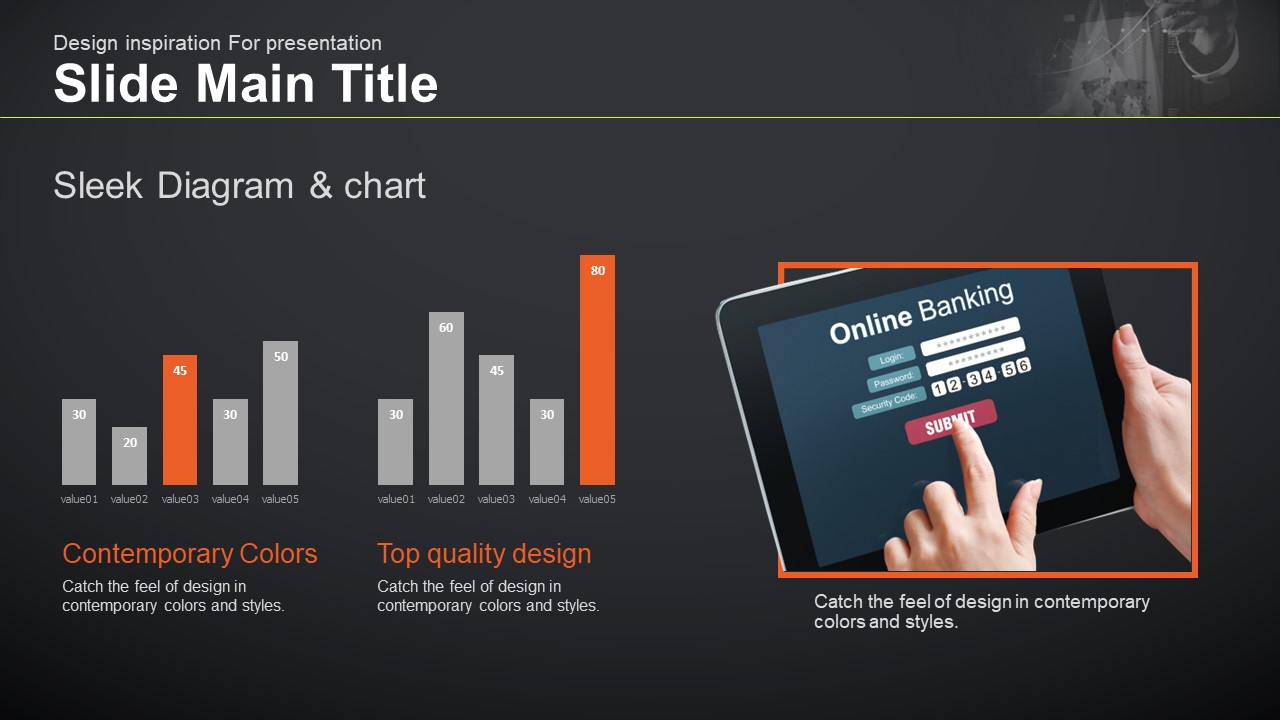
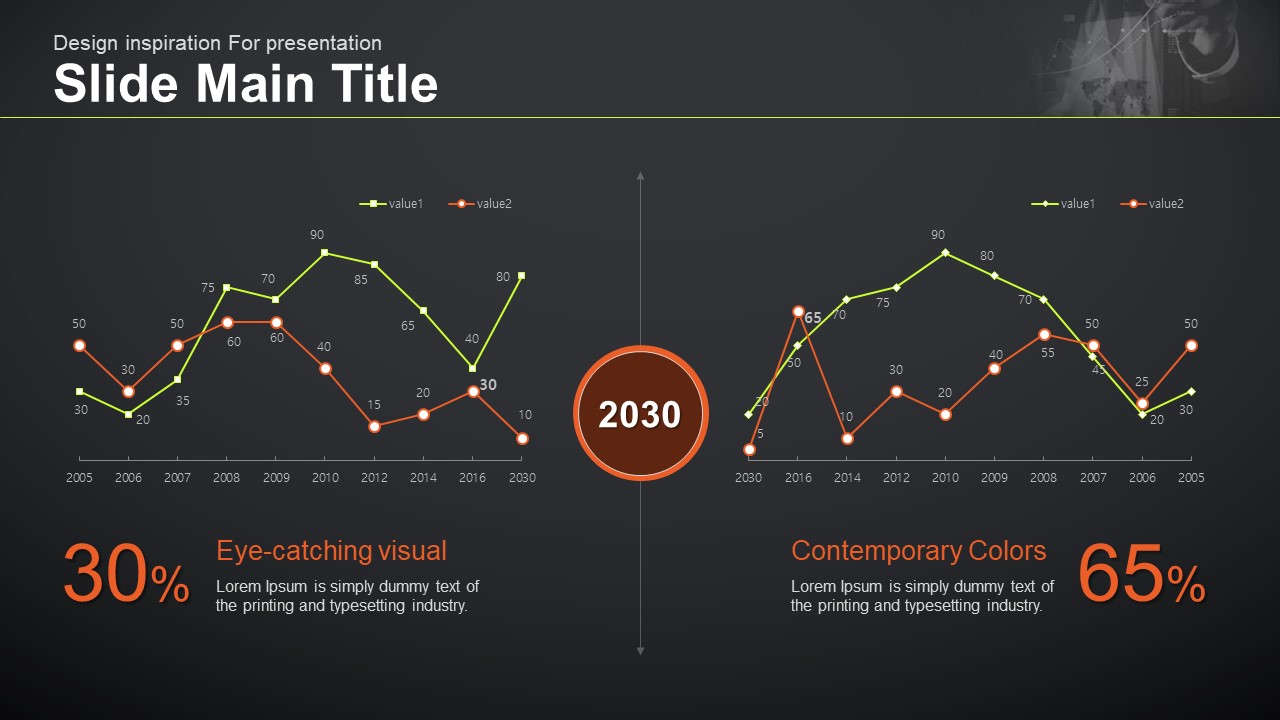
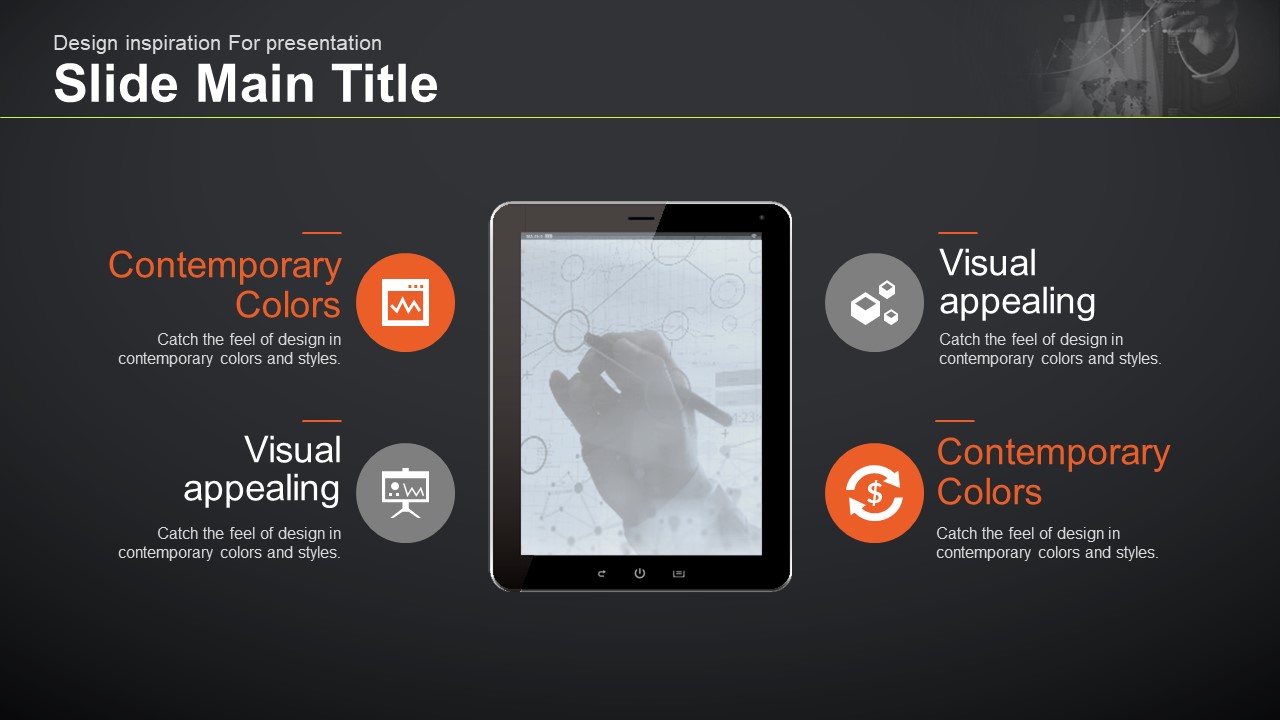
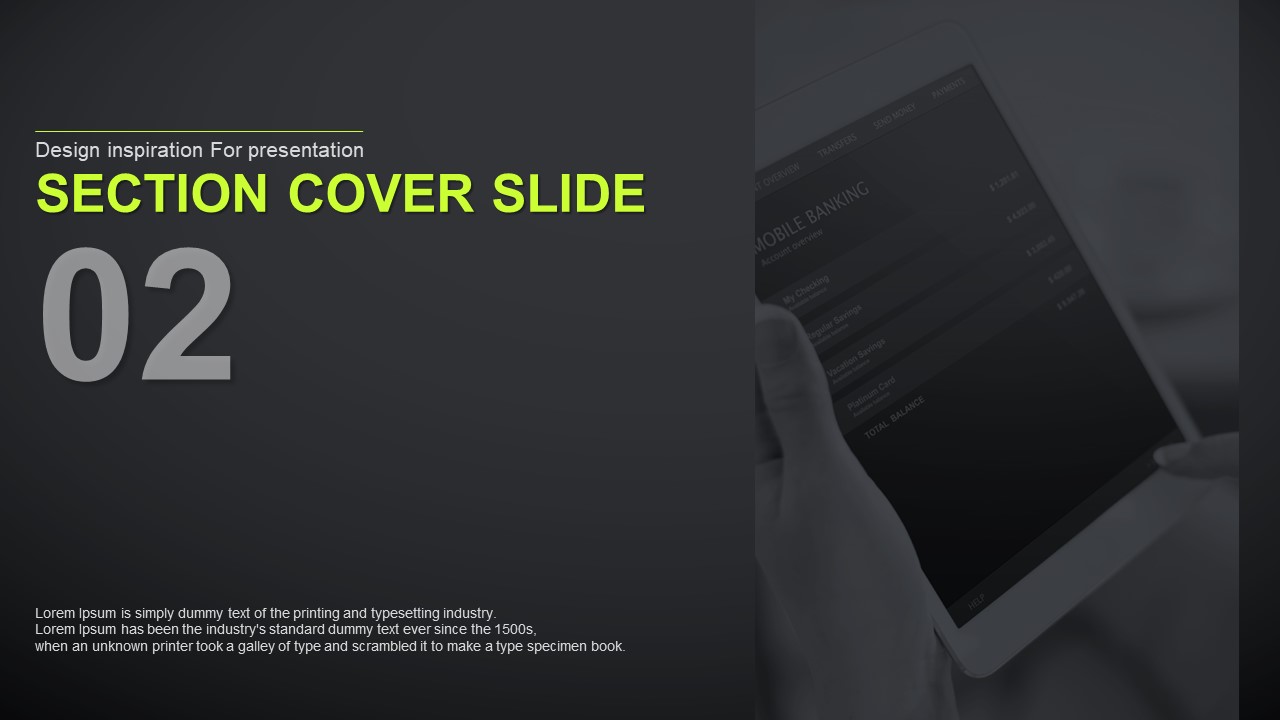
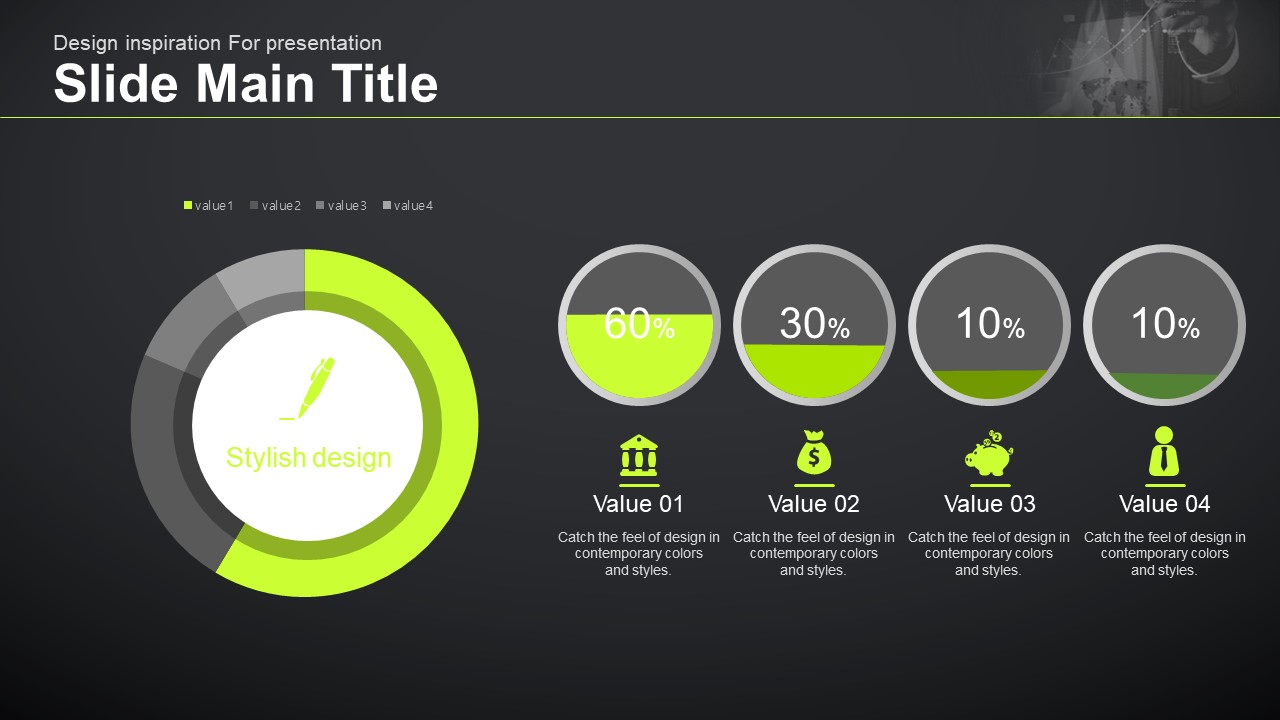
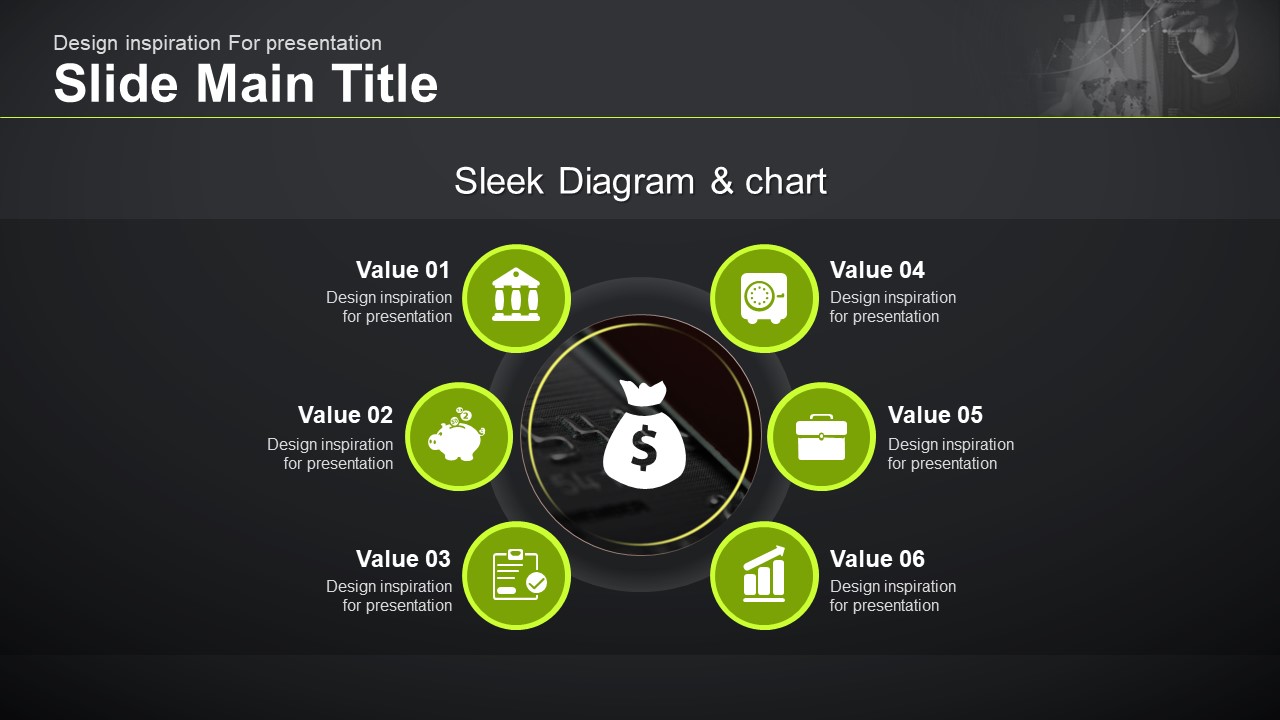
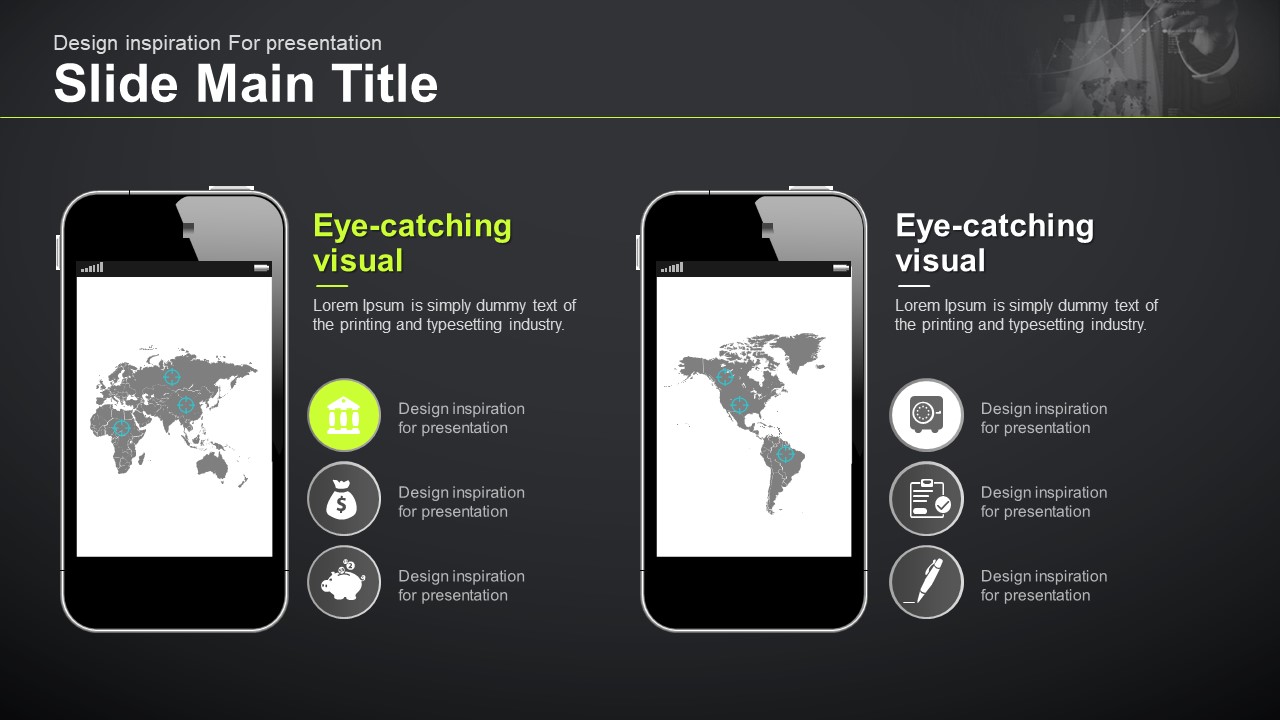
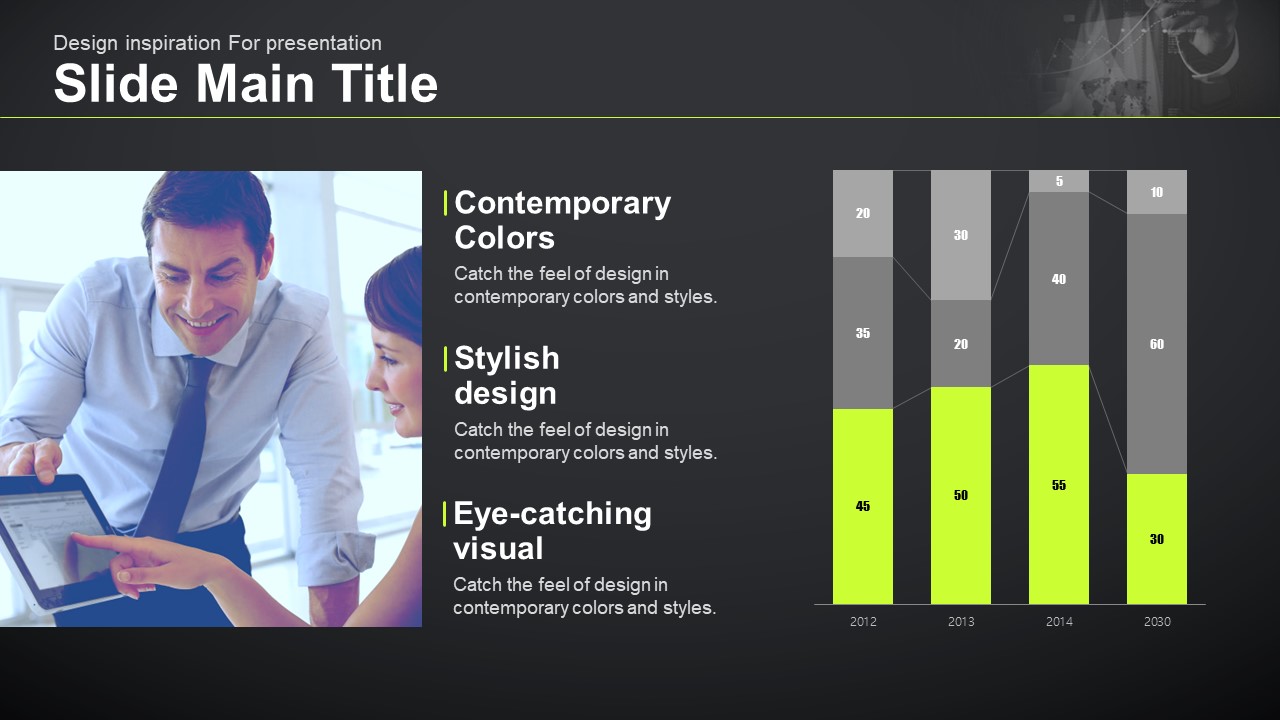
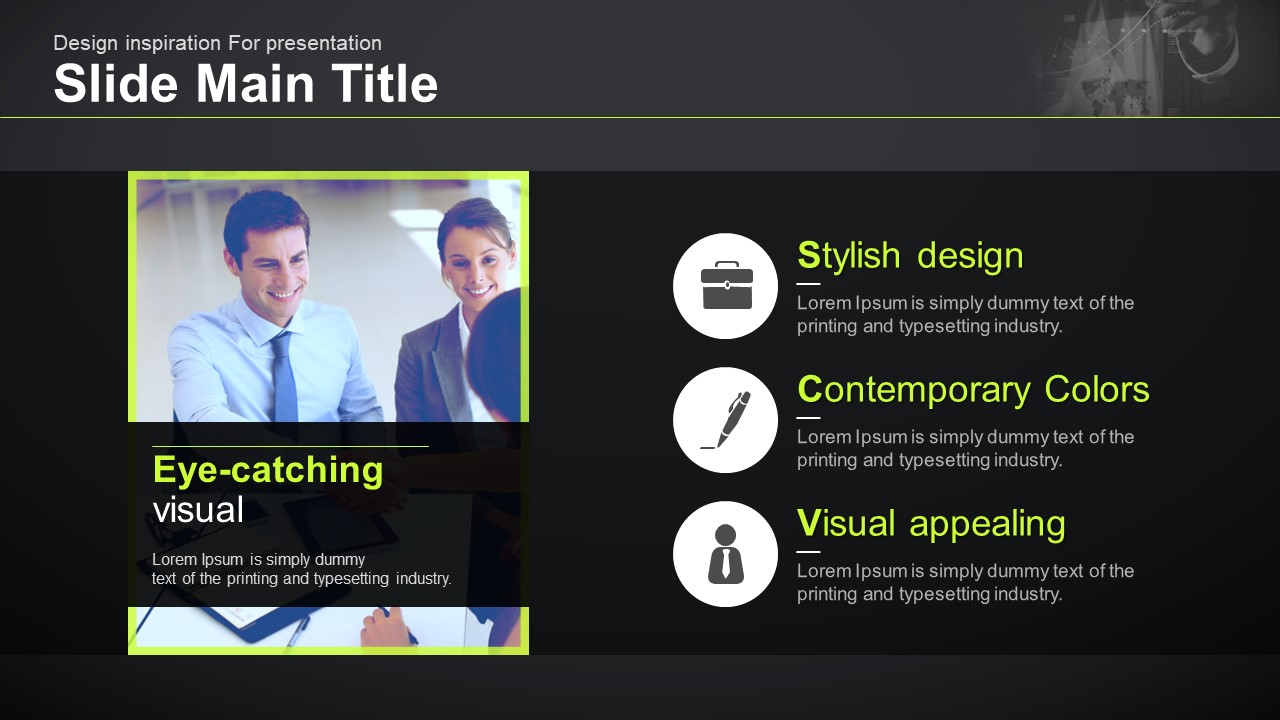
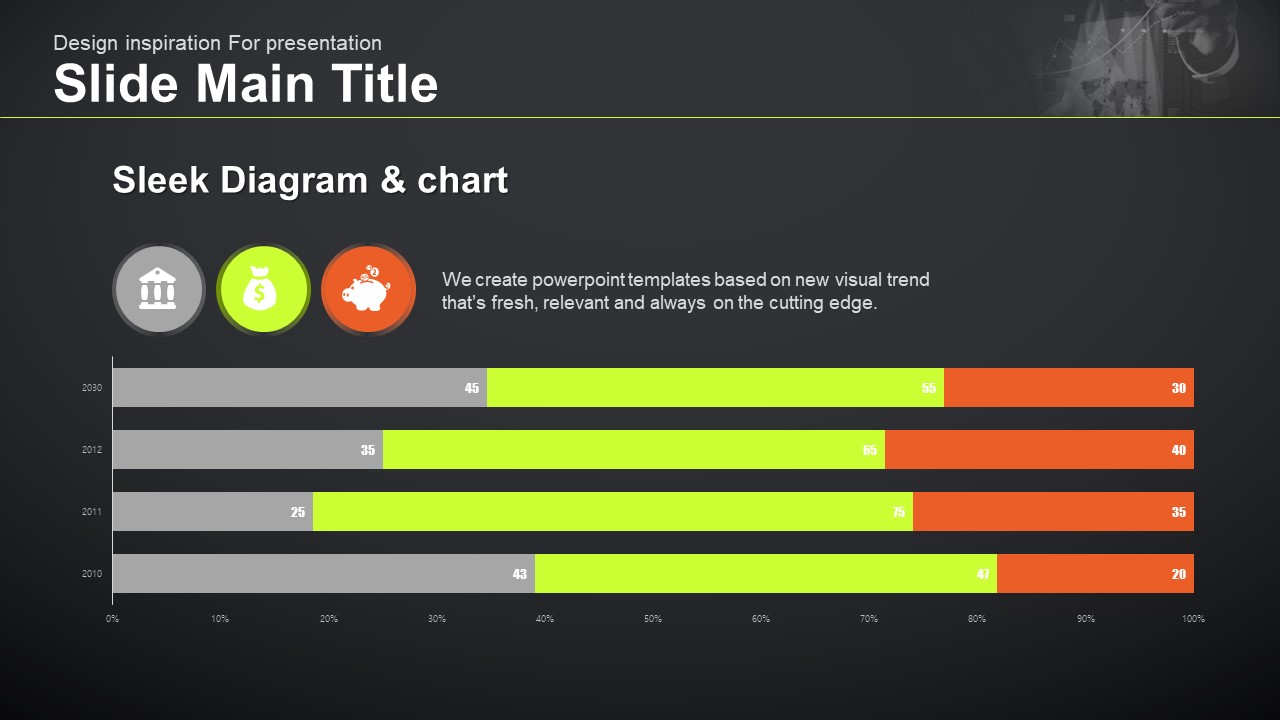
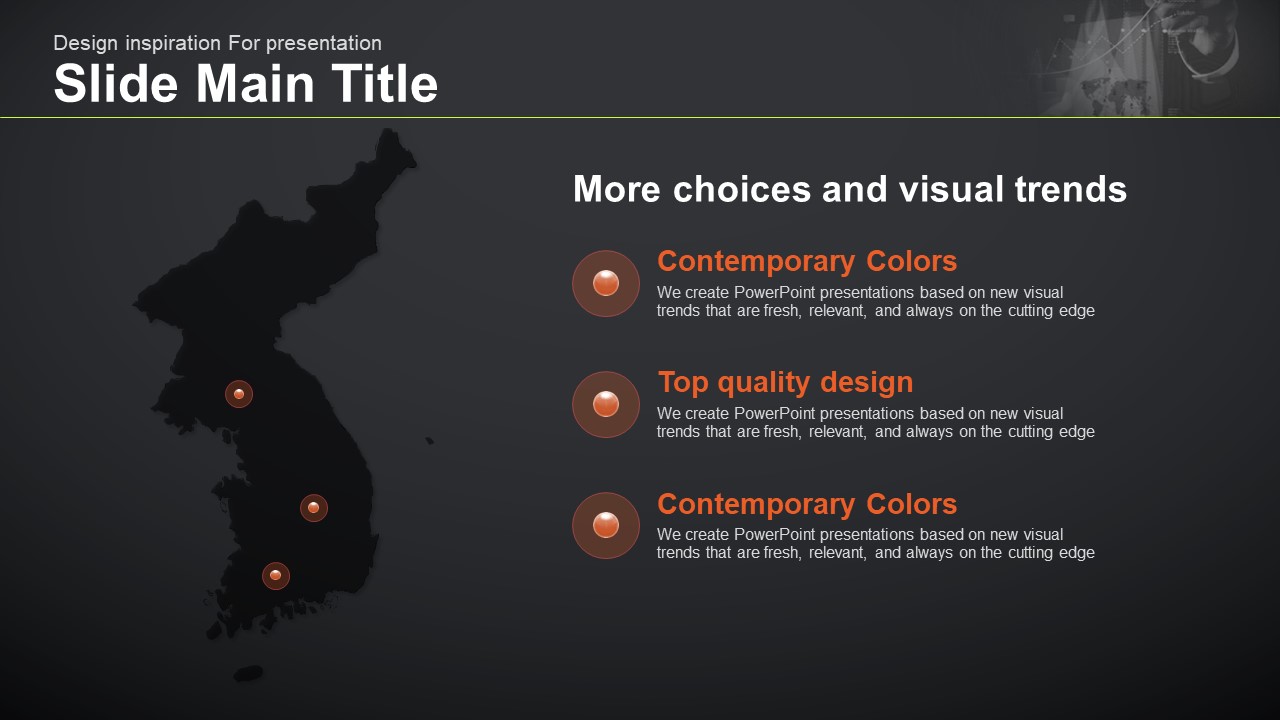
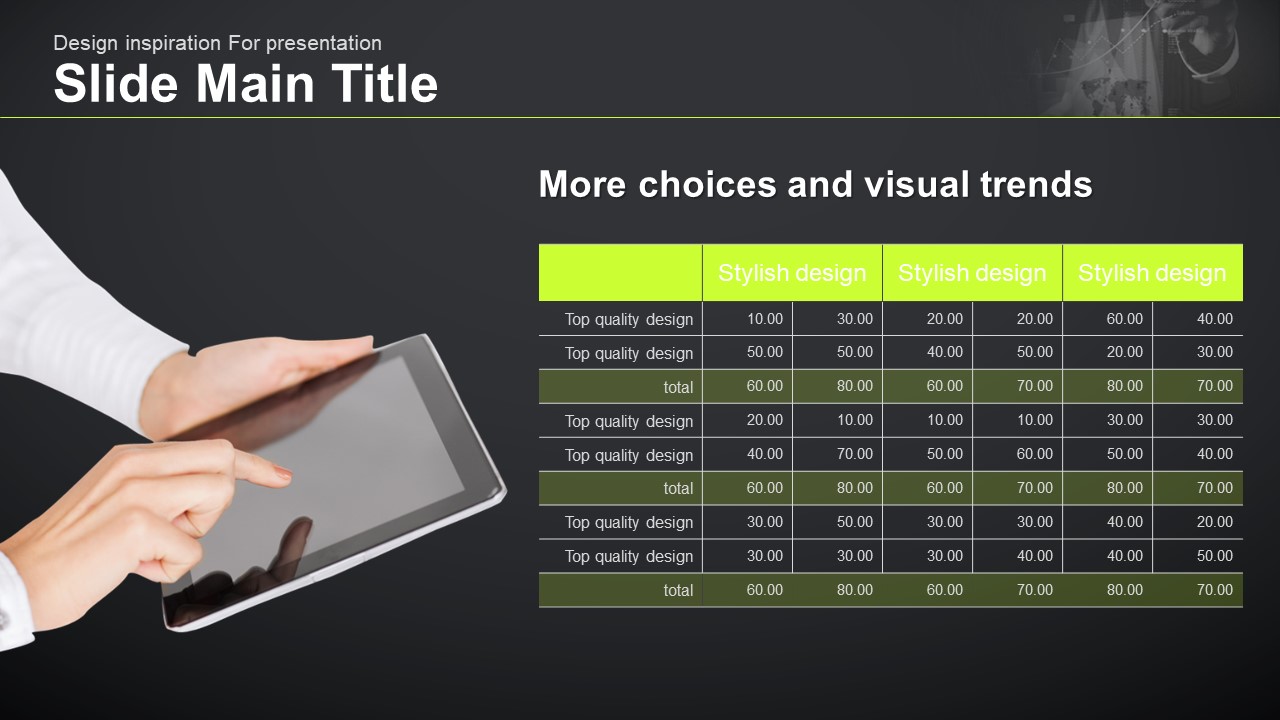
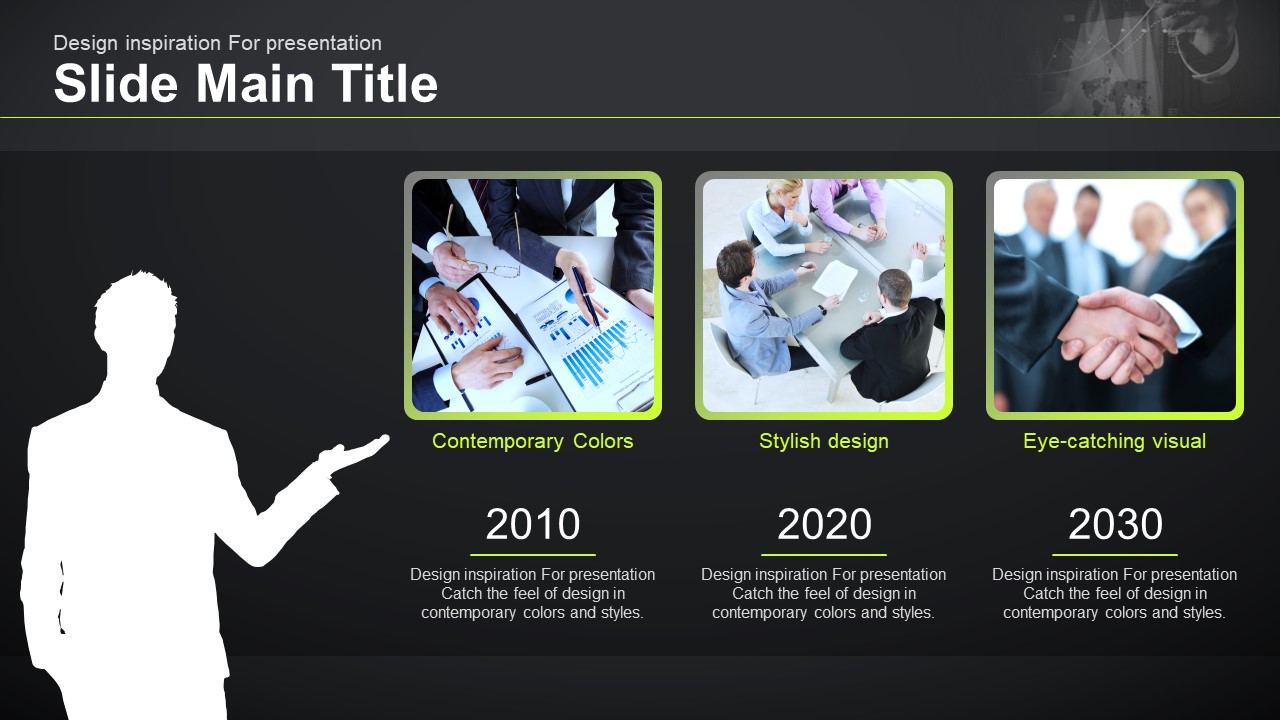
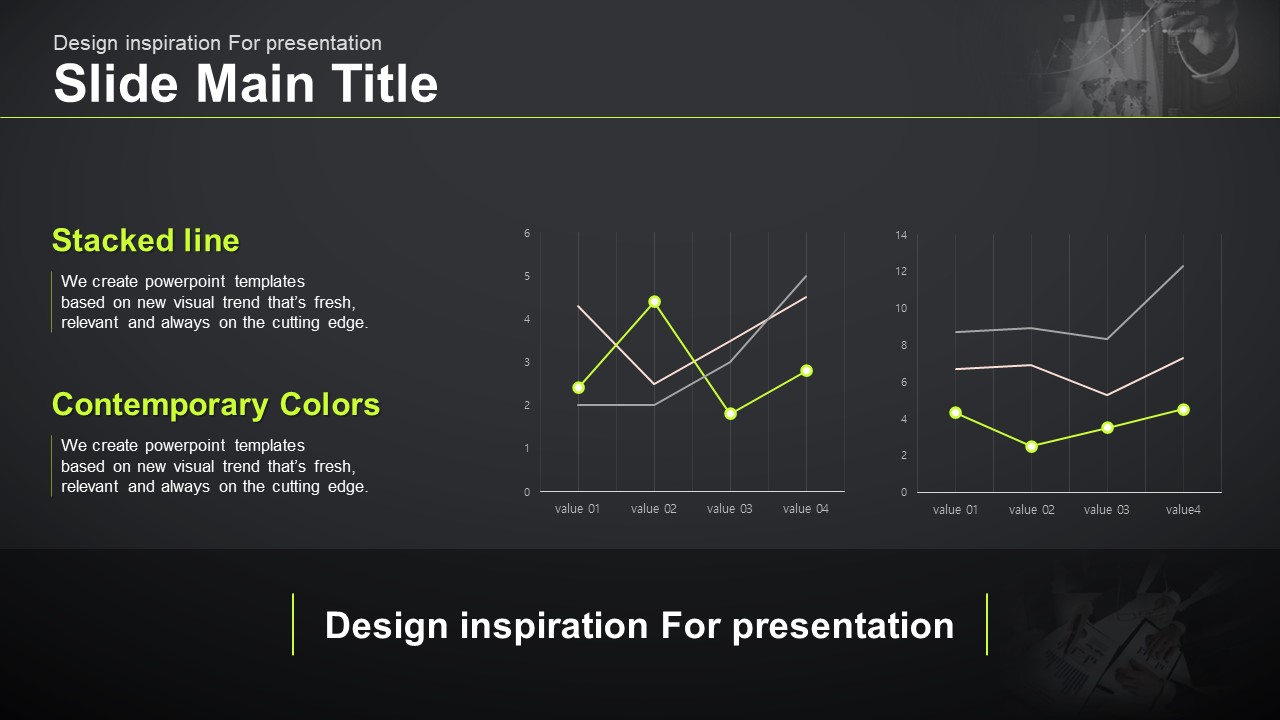
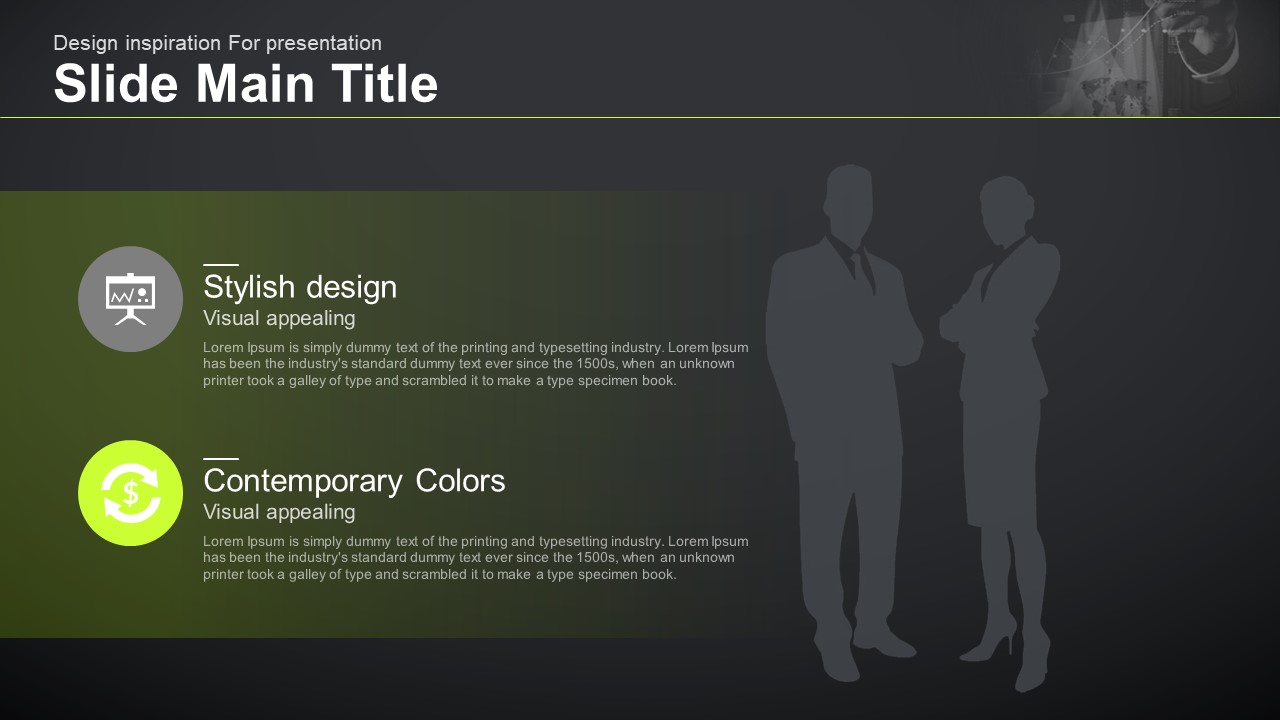
A professional financial business PowerPoint template built on a dark charcoal background with bold orange-red accent typography and green highlight colors. This 30-slide presentation deck covers all the essential layouts for finance and business presentations: a striking cover slide featuring a smartphone financial analysis visual, four-panel card layouts, line graph slides with percentage callouts (30%, 65%), horizontal bar chart slides for comparative data, circular bulb-shaped diagrams for three-step concepts, and six-section icon diagrams. Designed for investor meetings, quarterly earnings reports, and financial analysis presentations, this PPT template helps you visualize complex financial data with clarity and impact. The PPTX format is fully editable, and the 16:9 widescreen ratio ensures crisp display on large projection screens. Replace the placeholder text and chart data with your own figures to create polished financial slides in minutes.
Usage Points
-
Main Usage
Designed for investor pitches, quarterly earnings reports, and financial analysis presentations where data-driven storytelling and clear visual hierarchy are essential for audience impact.
-
How to Use
Download the PPTX file, replace placeholder text and chart values with your own financial data, and reorder slides as needed. All elements — icons, colors, fonts, and charts — are fully editable in PowerPoint.
-
Recommended For
CFOs, finance teams, IR managers, and business consultants who need to present financial data to investors, executives, or board members in a clear, professional, and visually compelling format.
-
Slide Structure
30 slides including: cover slide with smartphone financial visual, four-panel numbered card layout, line graph with percentage highlights, horizontal bar chart, circular bulb-shaped three-step diagram, and six-section icon diagram.
Related Products
-

Opinion PPT Wide – Stylish Design for Effective Presentations
#Business
-

Fountain Pen Theme Presentation – Elegant Business Slide Design
#Business
-

Ideas Conference Presentation Template – Stylish Business Design
#Business
-

Entertainment Company Presentation Template – Stylish and Colorful Design
#Business
