Business Income Statement Table – An Essential Tool for Performance Analysis
RJ0300073_26
- Last Update 05/09/2025
- File Size 1.6MB
- # of Slides 2
- File Format PPTX
- Slide Ratio 16:9
- Color
Keywords
- #Content-Based Slides
- #Design-Based Slides
- #Financial Plans and Performance
- #Diagram
- #Income Statement
- #Sales and Revenue
- #Table
- #Standard Table
- #16:9
- #income statement table PowerPoint
- #financial table slide template
- #data comparison table PPT
- #business table design
- #financial analysis slide download
About the Product
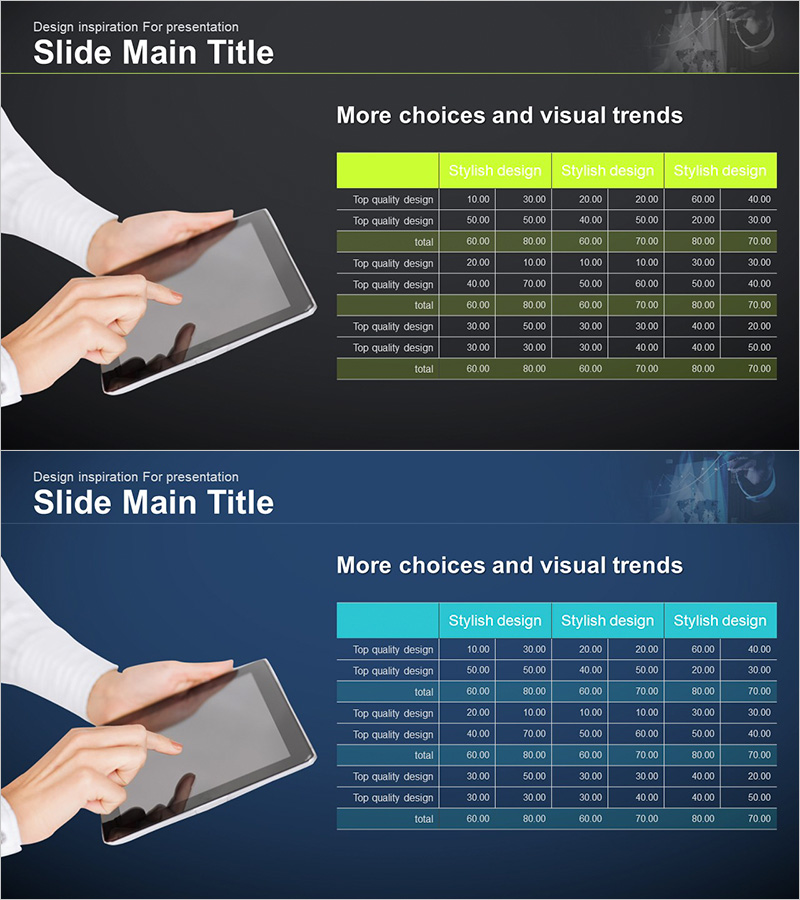
An income statement table PowerPoint slide designed for financial performance analysis and reporting. Two design variations are provided with black and dark blue backgrounds paired with lime green and teal headers. Each slide features a 3-row (product quality design rows plus total row) by 6-column data entry structure, enabling clear comparison of revenue, profit, and expense metrics at a glance. Delivered in 16:9 widescreen PPTX format for immediate editing. Ideal for business reports, financial planning presentations, and performance analysis briefings.
Usage Points
-
Main Usage
Present financial performance and income statement data visually through structured table layouts. Organize revenue, profit, and expense metrics in rows and columns for easy comparative analysis. Enhance business reports, financial planning decks, and quarterly performance presentations with clear numerical communication.
-
How to Use
Open the slide and input your actual financial data into each cell. Replace header labels (product quality design) with your own categories such as revenue, cost of goods sold, operating expenses, and net income. Choose between black or dark blue background themes to match your presentation style, then populate data rows with your figures.
-
Recommended For
CFOs, finance managers, and executives presenting quarterly or annual financial results. Suitable for investor presentations, shareholder meetings, and executive briefings. Effective for startup pitch decks during fundraising rounds and corporate internal management reporting sessions.
-
Slide Structure
Two-slide set with identical 3-row by 6-column table structure. First slide features lime green header row; second slide uses teal header. Each row accommodates product quality design entries with a total row at bottom. Six columns provide space for item names and five data points. Ample cell padding ensures easy numerical data entry and readability.
Related Products
-

Visualizing Projected Income, Expenses, and Key Metrics by Business
#Financial Plans and Performance #Diagram #Text Box
-

Business Income Statement Slide - Highlighting Financial Performance
#Financial Plans and Performance #Diagram #Income Statement
-

Sales and Profit Table – Visualizing Financial Performance
#Financial Plans and Performance #Diagram #Other
-

Business Income Statement – Visualizing Financial Performance
#Financial Plans and Performance #Diagram #Income Statement
