Analysis of Target Areas on the Korean Peninsula – Utilizing Cluster Diagram
RJ0300073_25
- Last Update 05/09/2025
- File Size 1.5MB
- # of Slides 2
- File Format PPTX
- Slide Ratio 16:9
- Color
Keywords
- #Content-Based Slides
- #Design-Based Slides
- #Market and Competitor Analysis
- #Marketing Plan and Strategy
- #Diagram
- #Other
- #Target Market
- #Target Market Strategy
- #Cluster
- #Closed Cluster Diagram
- #Map
- #16:9
- #Korean Peninsula map PowerPoint
- #regional analysis presentation slide
- #target area marker diagram
- #geography-based PPT template
- #Korea region analysis slide template
About the Product
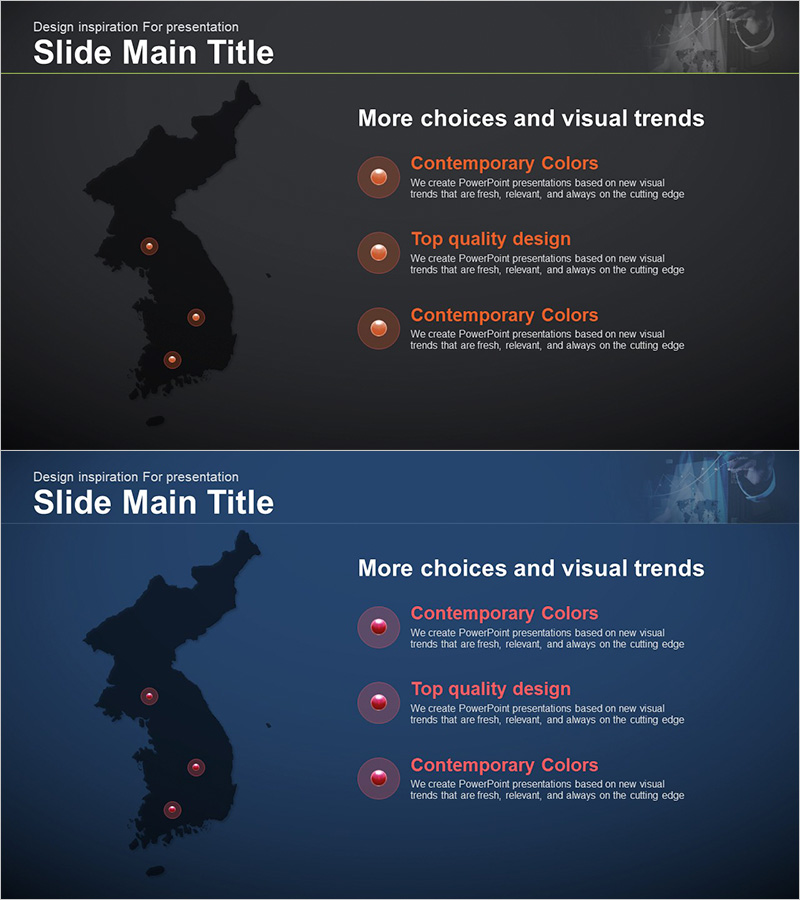
A PowerPoint slide featuring a map of the Korean Peninsula with three target regions marked by orange circular indicators, paired with text descriptions on the right. The dark background (charcoal and navy tones) contrasts with orange accent colors, making it ideal for geographic data visualization in market analysis, competitive positioning, sales strategy, and regional expansion presentations. The 2-slide set is ready to use across various business contexts including marketing, sales, and strategic planning. Compatible with all PowerPoint versions in 16:9 aspect ratio PPTX format with full editing capabilities.
Usage Points
-
Main Usage
Visualizes geographic information using the Korean Peninsula map to display target markets, competitor locations, sales offices, and distribution networks at a glance. Orange circular markers highlight key regions while the right-side text area provides detailed information for each location, directing audience attention to critical geographic data points.
-
How to Use
Ideal for business plans, marketing strategies, sales presentations, and market analysis reports where regional strategy explanation is needed. Edit text by clicking each marker area, and customize marker colors or quantity as required. The dark background creates a professional atmosphere suitable for executive-level presentations and formal business communications.
-
Recommended For
Marketing teams, sales departments, strategic planning units, and executives presenting region-based business strategies. Particularly effective for Korean market entry, regional sales analysis, distribution network development, competitive landscape mapping, and global expansion strategy presentations.
-
Slide Structure
Two-slide layout with each slide divided into map area (left 60%) and text area (right 40%). Three orange circular markers with gradient effects and central focal points are positioned on the Korean Peninsula map. The right side contains a title section and three text input areas for regional information, allowing customization of location-specific details.
Related Products
-

Analysis of US Target Regions – Strategic Marketing and Opportunities
#Market and Competitor Analysis #Marketing Plan and Strategy #Diagram
-

Export Strategy to Target Asian Countries
#Market and Competitor Analysis #Marketing Plan and Strategy #Diagram
-

Global Target Market Data Analysis - Insights into Markets
#Market and Competitor Analysis #Marketing Plan and Strategy #Diagram
-

Asia Map Target Region Strategy
#Market and Competitor Analysis #Marketing Plan and Strategy #Diagram
