Market Share Donut Pie Chart – Insightful Data Visualization
RJ0300073_5
- Last Update 05/09/2025
- File Size 2.6MB
- # of Slides 2
- File Format PPTX
- Slide Ratio 16:9
- Color
Keywords
- #Content-Based Slides
- #Design-Based Slides
- #Product/Service Introduction
- #Diagram
- #Graph
- #Program Introduction
- #Development Status
- #Cluster
- #Circles
- #Closed Cluster Diagram
- #Doughnut Chart
- #16:9
- #donut pie chart PowerPoint
- #pie chart slide template
- #market share visualization
- #data distribution chart
- #donut chart presentation template
About the Product
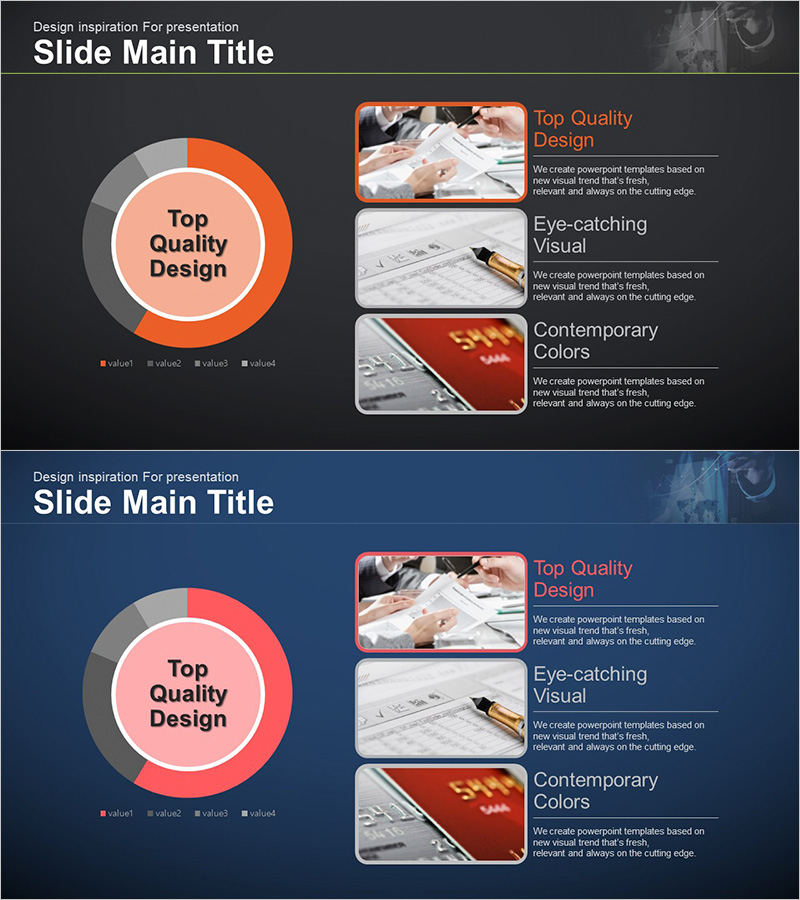
A professional donut pie chart PowerPoint slide designed to visualize market share, sales distribution, customer composition, and budget allocation data. Features a 4-segment donut chart with orange, pink, and gray color palette on a dark background, maximizing data emphasis in business presentations. The 2-slide set includes a chart-focused layout on slide 1 and a combined design on slide 2 with three image boxes and text descriptions for presenting insights alongside data. Delivered in 16:9 widescreen PPTX format, fully editable with customizable colors and fonts through the slide master.
Usage Points
-
Main Usage
Clearly presents proportional data such as market share, sales distribution, customer composition, and budget allocation. The donut center space accommodates key metrics or titles to enhance focus, while four color-coded segments enable intuitive differentiation of each data category.
-
How to Use
Ideal for executive reports, business analysis presentations, marketing strategy meetings, and investor pitch decks. Utilize slide 2's image boxes and text areas to present chart interpretation, key insights, and action items alongside the visualization.
-
Recommended For
Finance and planning teams conducting quarterly or annual performance analysis, marketing teams analyzing channel or product revenue composition, executives presenting company-wide status reports, and consulting firms delivering client analysis materials. Suitable for any business presentation requiring data-driven decision support.
-
Slide Structure
Slide 1: Dark background with 4-segment donut chart (orange, pink, gray, light tones) on left side, legend with 4 items. Slide 2: Donut chart on left, three image boxes with orange borders and text description area on right. 16:9 widescreen format, PPTX file.
Related Products
-

Construction Business Analysis Donut Chart
#Product/Service Introduction #Business Introduction #Diagram
-

Automotive Technology Revenue Model Analysis Chart – Modern and Sleek Design
#Product/Service Introduction #Business Introduction #Diagram
-

Mobile App Market Share Analysis Graph
#Product/Service Introduction #Market and Competitor Analysis #Diagram
-

Donut Diagram Visualizing Technology Development Status
#Company Introduction #Product/Service Introduction #Diagram
