Business Goal Setting & Analysis Graph – For Competitive Analysis
RJ0300073_22
- Last Update 05/09/2025
- File Size 4.8MB
- # of Slides 2
- File Format PPTX
- Slide Ratio 16:9
- Color
Keywords
- #Content-Based Slides
- #Design-Based Slides
- #Market and Competitor Analysis
- #Marketing Plan and Strategy
- #Graph
- #Competitor Analysis
- #Market Analysis
- #Marketing Objectives
- #Column
- #Segmented Column
- #16:9
- #vertical bar chart PowerPoint
- #bar graph slide template
- #data comparison chart
- #competitive analysis PowerPoint
- #trend analysis slide
About the Product
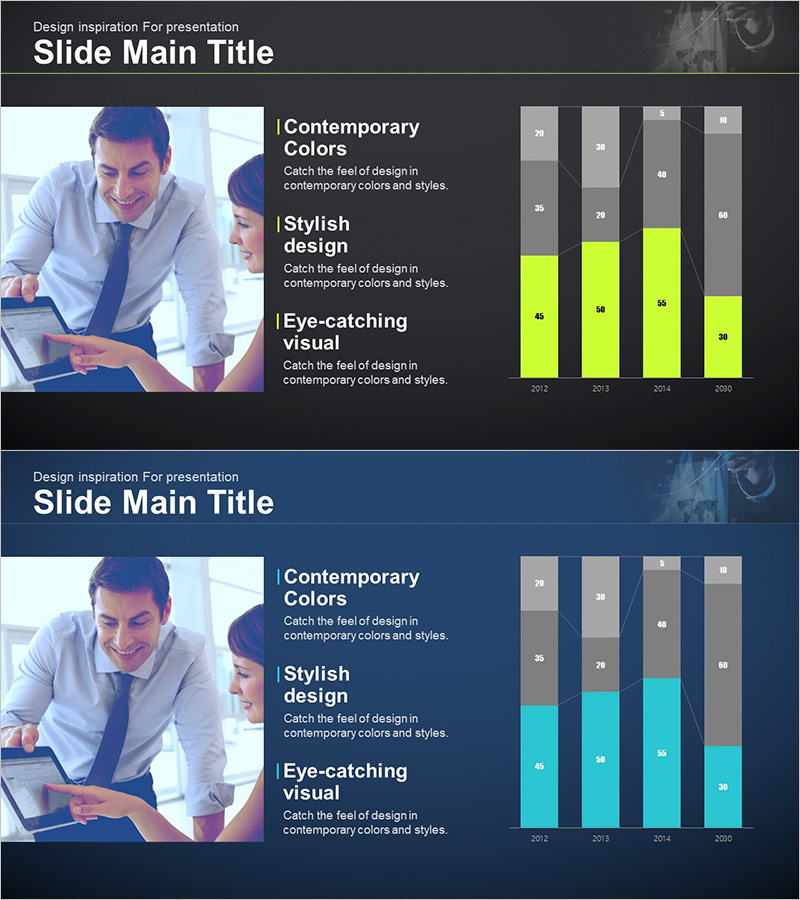
A vertical bar chart PowerPoint slide designed for business goal setting and competitive analysis. This presentation template visualizes data across four years (2012–2020) using vertical bars to compare market share, revenue trends, and competitor performance. The dark background with neon lime green accent colors makes key metrics stand out, while the left text area and right chart area are balanced for professional presentations. Perfect for business reports, marketing strategy decks, and competitive analysis presentations where numerical comparison and trend analysis are essential.
Usage Points
-
Main Usage
Visualizes year-over-year and item-by-item numerical comparisons and trend analysis. Effectively displays competitor performance benchmarking, market share evolution, revenue progression, and goal achievement metrics using quantitative data with neon accent colors to highlight key figures.
-
How to Use
Insert into marketing strategy decks, business reports, or competitive analysis presentations in the market analysis or competitor benchmarking section. Enter analysis points in the left text area and input actual data into the right chart for immediate use in your presentation.
-
Recommended For
Marketing professionals, strategy planners, executives, consultants, and analysts presenting competitive analysis, market research, and performance comparisons. Ideal for any business presentation requiring data-driven decision-making visuals and quantitative analysis.
-
Slide Structure
Two-slide template with each slide featuring a left text area (three bullet points) and right vertical bar chart (4 years × 4 data series). Dark background with neon lime green, cyan, and gray bar colors for data differentiation. 16:9 widescreen format optimized for modern presentation environments.
Related Products
-

Business Meeting Results Analysis Graph
#Market and Competitor Analysis #Graph #Competitor Analysis
-

Stack Bar Chart Map for Market and Competitor Analysis
#Market and Competitor Analysis #Marketing Plan and Strategy #Graph
-

Monthly Analysis Graph of Banking Services Sector – Market and Competitor Analysis
#Market and Competitor Analysis #Financial Plans and Performance #Graph
-

Analysis of Courier Brand Usage Status – Insights on Competitors
#Market and Competitor Analysis #Graph #Competitor Analysis
