Internet Business Analysis Graph - Powerful Data Visualization
RJ0300073_9
- Last Update 05/09/2025
- File Size 1.3MB
- # of Slides 2
- File Format PPTX
- Slide Ratio 16:9
- Color
Keywords
- #Content-Based Slides
- #Design-Based Slides
- #Company Introduction
- #Business Strategy
- #Graph
- #Other
- #Key Achievements
- #Financial Outlook & Expected Impact
- #Column
- #Segmented Column
- #Mockup
- #16:9
- #vertical bar chart PowerPoint
- #bar graph presentation slide
- #data visualization template
- #business analysis chart
- #tablet mockup slide
- #how to create bar chart in PowerPoint
About the Product
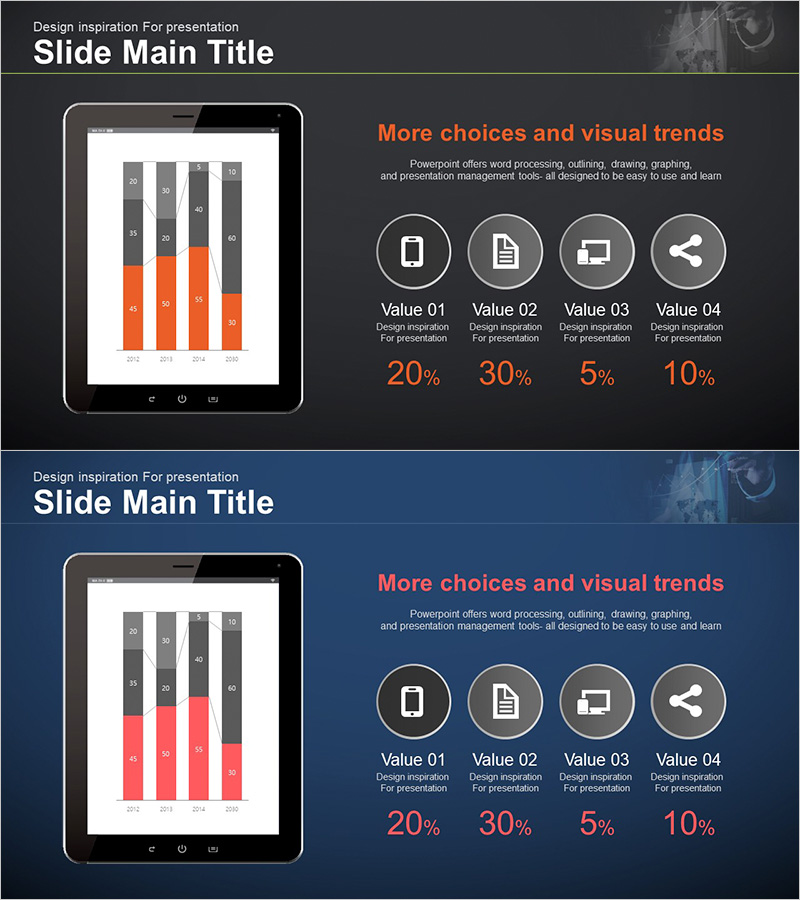
A vertical bar chart PowerPoint slide designed for internet business analysis and data visualization. This 2-slide presentation features a tablet device mockup displaying five data categories in gray and orange colors for clear comparison. Each bar includes numeric labels for immediate presentation use. The dark background with orange accent colors creates strong contrast to highlight key data points, making it ideal for business analysis, market research, and performance reporting presentations. Provided in 16:9 widescreen PPTX format for easy editing and customization.
Usage Points
-
Main Usage
Visualize internet business and marketing analysis data through vertical bar charts to clearly communicate numeric comparisons and trends. The tablet device mockup emphasizes digital environment data representation, while gray and orange contrast highlights critical metrics.
-
How to Use
Apply to business reports, marketing plans, and performance analysis presentations in data comparison sections. Use the tablet screen display to represent mobile and web business indicators, competitive analysis results, or market research findings effectively.
-
Recommended For
Recommended for marketing managers, business analysts, sales executives, and report creators. Particularly suitable for internet companies, IT startups, digital marketing agencies, and consulting firms presenting data-driven insights.
-
Slide Structure
Two-slide layout with tablet device mockup centered on each slide and four icons with four value items (20%, 30%, 5%, 10%) positioned on the right. The bar chart displays five categories (2012-2016 or custom categories) in gray and orange colors with numeric labels on each bar for precise data representation.
Related Products
-

Vertical Bar Segmentation Graph – Business Performance and Revenue Outlook
#Company Introduction #Business Strategy #Graph
-

Visualizing the Changing Trend of the Ageing Population with a 100% Stacked Bar Graph
#Business Strategy #Market and Competitor Analysis #Marketing Plan and Strategy
-

Profitability Analysis Segmentation Graph – Market Status and Strategy
#Business Strategy #Market and Competitor Analysis #Graph
-

Modern Business PowerPoint Template – Business Strategy and Market Analysis
#Business Strategy #Market and Competitor Analysis #Graph
