Comparative Analysis Vertical Bar Graph for Market Insights
RJ0300073_12
- Last Update 05/08/2025
- File Size 2.3MB
- # of Slides 2
- File Format PPTX
- Slide Ratio 16:9
- Color
Keywords
- #Content-Based Slides
- #Design-Based Slides
- #Market and Competitor Analysis
- #Graph
- #Other
- #Competitor Analysis
- #Market Analysis
- #Column
- #Column Chart
- #16:9
- #vertical bar chart PowerPoint
- #bar graph presentation slide
- #data comparison analysis PPT
- #market competitiveness visualization
- #competitive analysis chart
- #chart PowerPoint slide template
About the Product
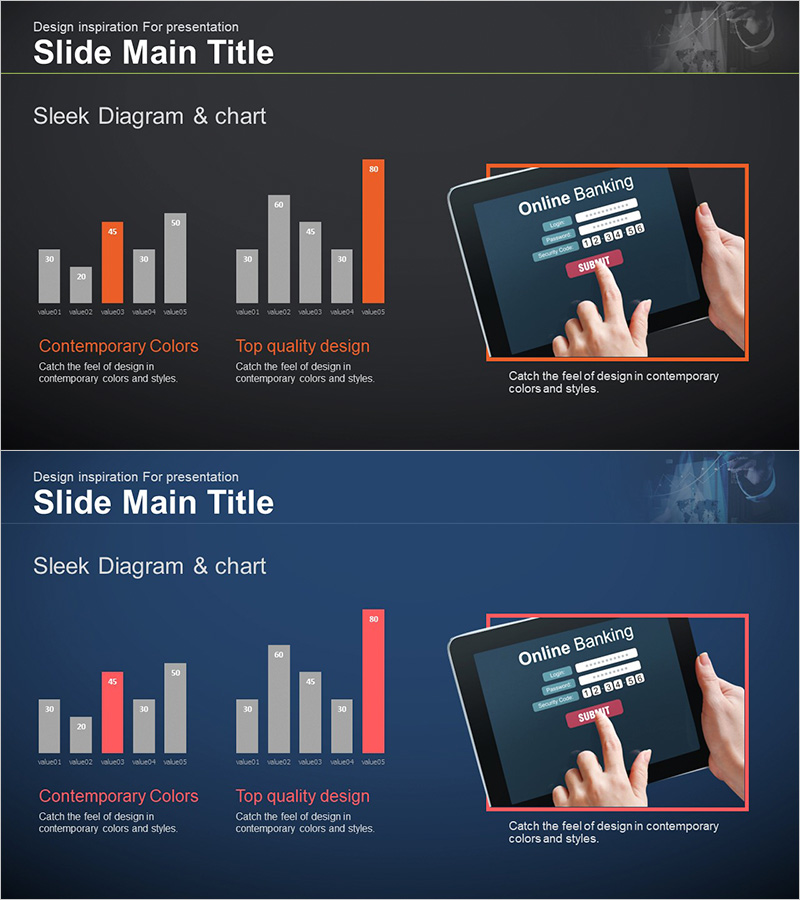
A vertical bar chart PowerPoint slide designed to clearly visualize market competitiveness and data comparison. The dark background with orange accent color highlights key items, enabling at-a-glance comparison of 10 data points. The layout features a left graph for current status analysis and a right graph for competitive benchmarking, complemented by an online banking app UI mockup image showing real-world application. Composed of 2 slides in 16:9 aspect ratio, this presentation template is ready to use in marketing strategy, market analysis, and competitive analysis sections.
Usage Points
-
Main Usage
Optimized for visually communicating market competitiveness analysis and competitive benchmarking data. The vertical bar chart's height differences provide intuitive numerical comparison, while the orange accent color emphasizes key items to increase audience engagement.
-
How to Use
Apply this slide in the market analysis section of marketing plans, business reports, and investor pitch decks. Input your company's data in the left graph and competitor data in the right graph to complete the comparative analysis structure. Replace the mockup image area with actual product or service screenshots to strengthen context.
-
Recommended For
Marketing professionals, business planners, and executives preparing competitive analysis materials. Particularly valuable in finance, IT, and e-commerce industries for presenting market share, customer satisfaction, and performance metrics comparisons. Suitable for any business presentation requiring data-driven decision-making materials.
-
Slide Structure
2-slide composition. Each slide features two vertical bar charts (10 items each) on the left and right, with a mockup image area in the upper right. Dark background (black and dark gray) with orange accent bars, gray comparison bars, and white text labels create clear visual contrast.
Related Products
-

Visualizing Bar Graphs with PC Mockups – Competitive Market Analysis Tool
#Market and Competitor Analysis #Graph #Other
-

Vertical Bar Graph for Market Analysis – Visualizing Performance Against Competitors
#Market and Competitor Analysis #Graph #Competitor Analysis
-

Horizontal Bar Chart Slide for USA Market Analysis
#Market and Competitor Analysis #Graph #Other
-

Segmented Square 3D Graph: Market & Competitive Analysis
#Market and Competitor Analysis #Graph #Other
