Financial Management Analysis Status Graph
RJ0300073_18
- Last Update 05/09/2025
- File Size 1.3MB
- # of Slides 2
- File Format PPTX
- Slide Ratio 16:9
- Color
Keywords
- #Content-Based Slides
- #Design-Based Slides
- #Product/Service Introduction
- #Business Introduction
- #Graph
- #Other
- #Development Status
- #Technological Status
- #Circles
- #Doughnut Chart
- #16:9
- #donut pie chart PowerPoint
- #circular chart slide template
- #financial ratio analysis graph
- #4-segment pie chart
- #budget allocation visualization PPT
- #how to create pie chart in PowerPoint
About the Product
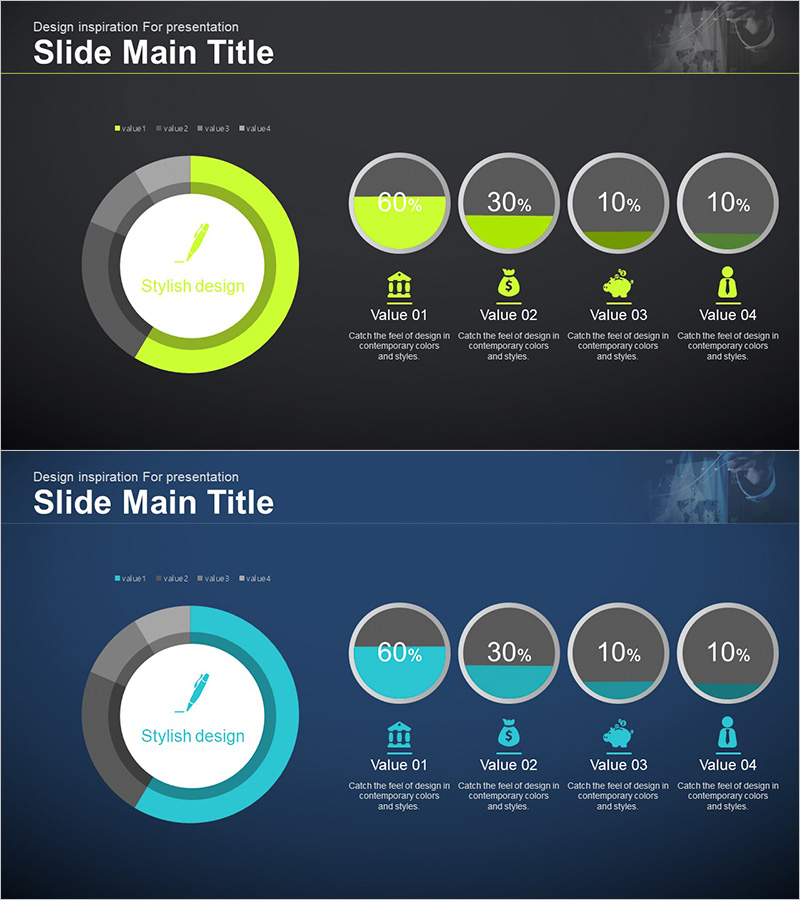
A visually compelling donut pie chart PowerPoint slide designed to present financial management data and budget allocation ratios. The slide features a central donut-shaped circle with key metrics, complemented by four circular percentage indicators on the right side displaying data distribution. The lime green and dark gray color contrast enhances data emphasis, while icons and descriptive text beneath each segment improve information clarity. The 2-slide set offers multiple color variations (lime, cyan, gray) enabling immediate customization to match corporate branding. Each segment is fully editable, allowing seamless integration of your financial figures and labels into presentations.
Usage Points
-
Main Usage
Effectively communicate financial management status, budget distribution, cost composition, and revenue ratios across four key segments. The central donut area draws attention to primary metrics or titles, while the right-side pie chart displays precise percentages with numerical values for each category.
-
How to Use
Ideal for financial reports, business plans, investor presentations, and management briefings where financial data visualization is essential. Simply input your figures and the proportions automatically adjust. Colors and icons are fully customizable to align with your corporate identity. Choose from two color-themed slides to match your presentation style.
-
Recommended For
Finance teams, executives, CFOs, business development professionals, consultants, and investor relations specialists presenting financial performance. Perfect for quarterly and annual financial reviews, budget planning meetings, shareholder reports, and strategic management discussions requiring data-driven insights.
-
Slide Structure
Slide 1: Lime green background with central donut circle and four pie segments (60%, 30%, 10%, 10%), icons, and legend labels. Slide 2: Cyan background with identical layout in alternate color scheme. 16:9 aspect ratio, PPTX format, 2-slide set.
Related Products
-

Analysis of Social Media Cloud Development Status – Stylish Donut Chart
#Product/Service Introduction #Business Introduction #Graph
-

Mobile App Service Development Status – Doughnut Chart Visualization
#Product/Service Introduction #Business Introduction #Graph
-

Technology Achievement Donut Chart
#Product/Service Introduction #Business Introduction #Graph
-

Business Development Status Donut Graph – A Template for Visual Communication
#Product/Service Introduction #Business Introduction #Diagram
