Financial Management Analysis Detailed Graph
RJ0300073_24
- Last Update 05/09/2025
- File Size 1.3MB
- # of Slides 2
- File Format PPTX
- Slide Ratio 16:9
- Color
Keywords
- #Content-Based Slides
- #Design-Based Slides
- #Market and Competitor Analysis
- #Graph
- #Competitor Analysis
- #Market Analysis
- #Horizontal Bar
- #Segmented Horizontal Bar
- #16:9
- #horizontal stacked bar chart PowerPoint
- #multi-series graph template
- #financial analysis slide
- #competitive analysis chart
- #how to create stacked bar chart in PowerPoint
About the Product
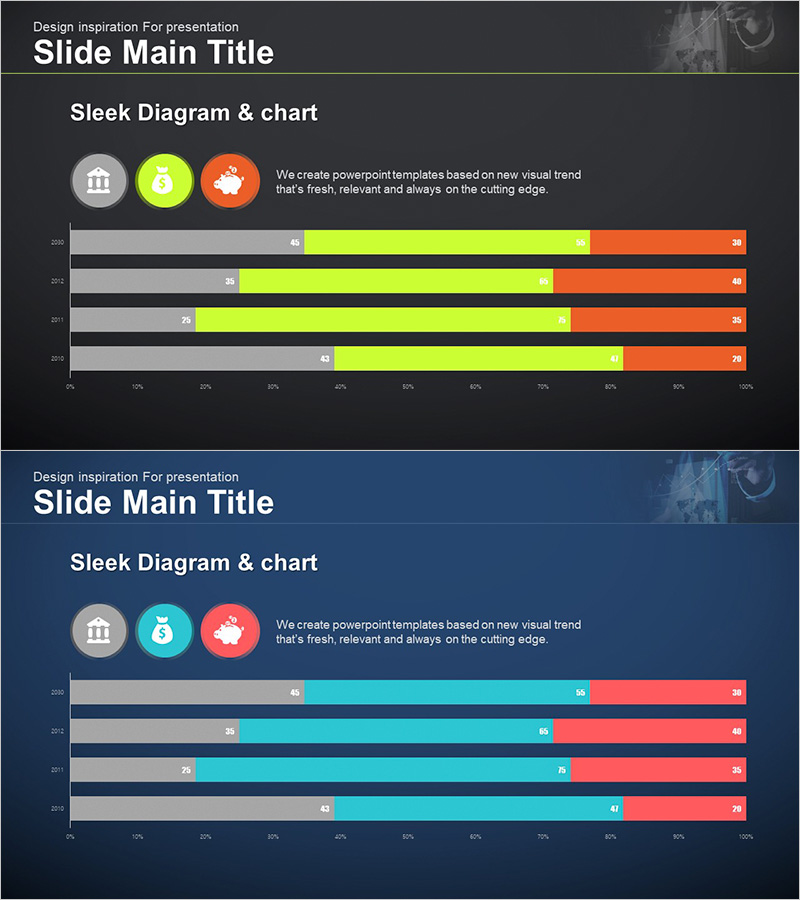
A horizontal stacked bar chart PowerPoint slide optimized for financial management and market analysis presentations. Set against a dark gray background, this slide uses lime green, cyan, and orange colors to represent four data series across four years (2020–2023) in a segmented bar format. Each bar displays percentage values and is subdivided to support competitive analysis, budget allocation, and performance comparison scenarios. The 2-slide set includes a color variant with a dark blue background, both in 16:9 widescreen format for immediate deployment in modern presentation environments.
Usage Points
-
Main Usage
Visualizes complex multi-category data (by year, department, or product) using percentage-based horizontal bars to enable clear comparative analysis. Ideal for presenting financial status, budget distribution, market share, and performance trends in quantitative formats.
-
How to Use
Replace the bar colors and numerical values with your own data. Choose between dark gray or dark blue background options to match your corporate branding, and customize the icons (building, finance, cloud) to reinforce context and messaging.
-
Recommended For
Finance and marketing team reports, quarterly and annual performance reviews, competitive benchmarking analysis, budget planning and resource allocation meetings, investor relations presentations, and data analysis sections in consulting proposals.
-
Slide Structure
2-slide set. Each slide features a horizontal stacked bar chart with 4 years (2020–2023) × 4 data series (gray, lime, cyan, orange) displayed as segmented bars. A 0–100% scale axis runs horizontally, with numerical labels on each segment. Three icons and a descriptive text area are positioned at the top of each slide.
Related Products
-

Market Analysis Graph Ahead of the Future – Innovative Business Insights
#Market and Competitor Analysis #Diagram #Graph
-

Segmented Bar Graph for Market and Competitor Analysis
#Market and Competitor Analysis #Graph #Competitor Analysis
-

Chemical Experiment Analysis Horizontal Bar Graph
#Market and Competitor Analysis #Graph #Competitor Analysis
-

Segmented Graph of Learning Goal Achievement – Market and Competitor Analysis
#Market and Competitor Analysis #Graph #Competitor Analysis
