
Learning PPT Wide – Educational and Creative Slide Design
J0500014
- Last Update 01/08/2025
- File Size 10.5MB
- # of Slides 20
- File Format PPTX
- Slide Ratio 16:9
- Color
Slide Preview


Keywords
About the Product
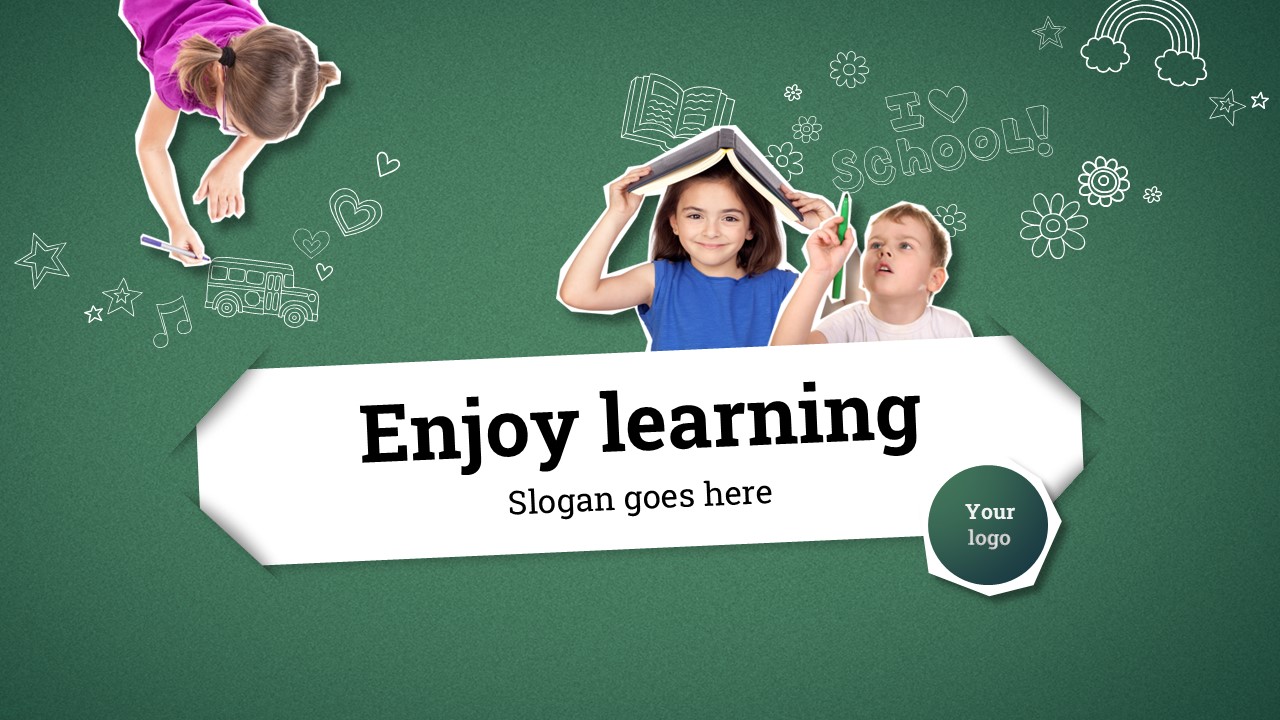
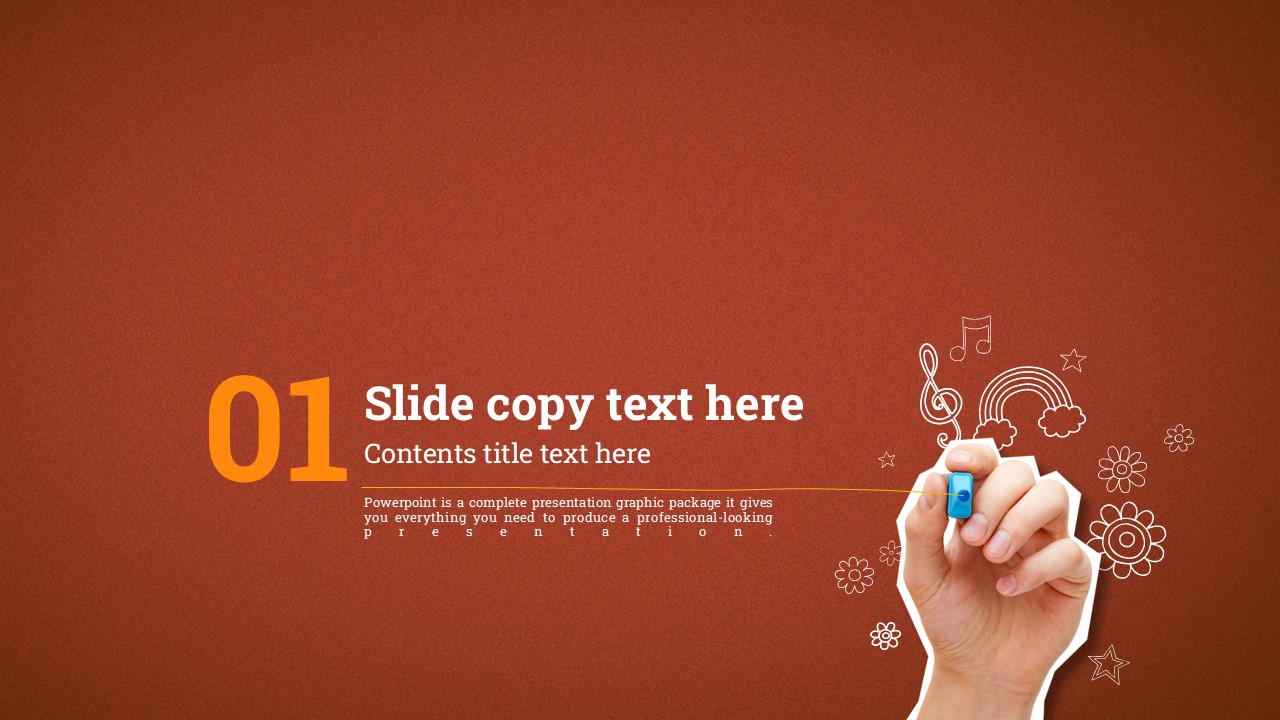
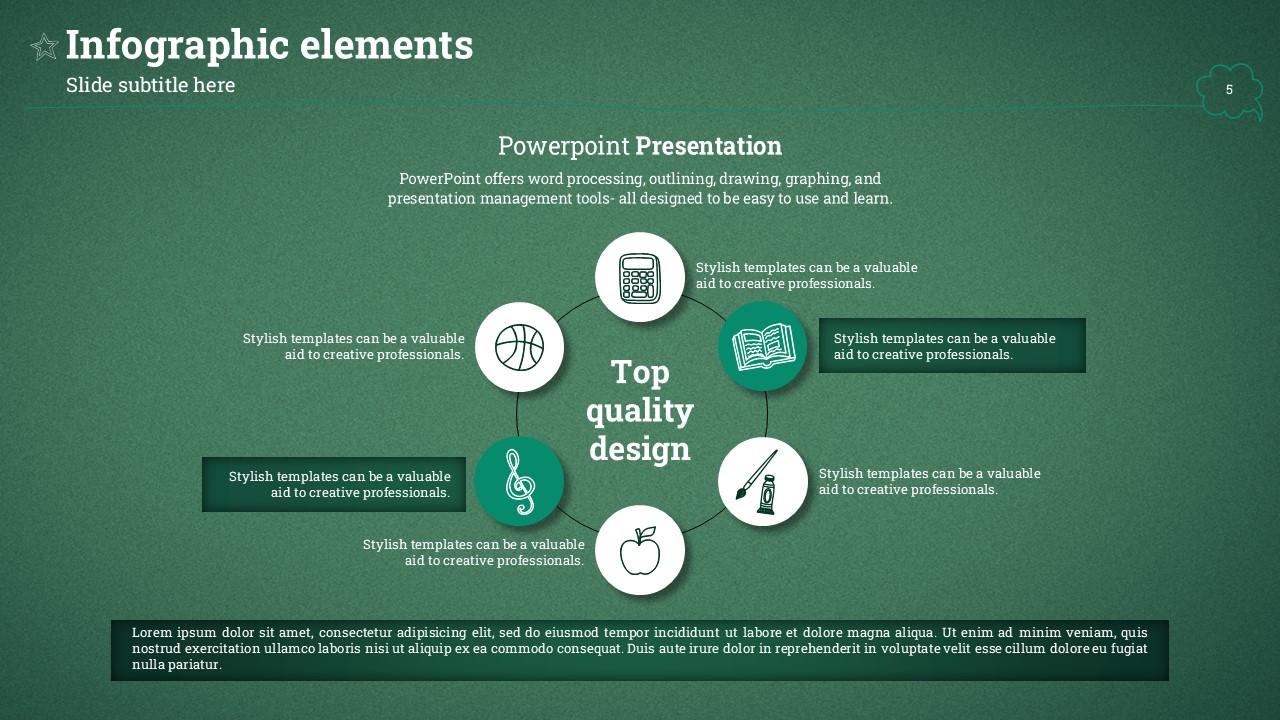
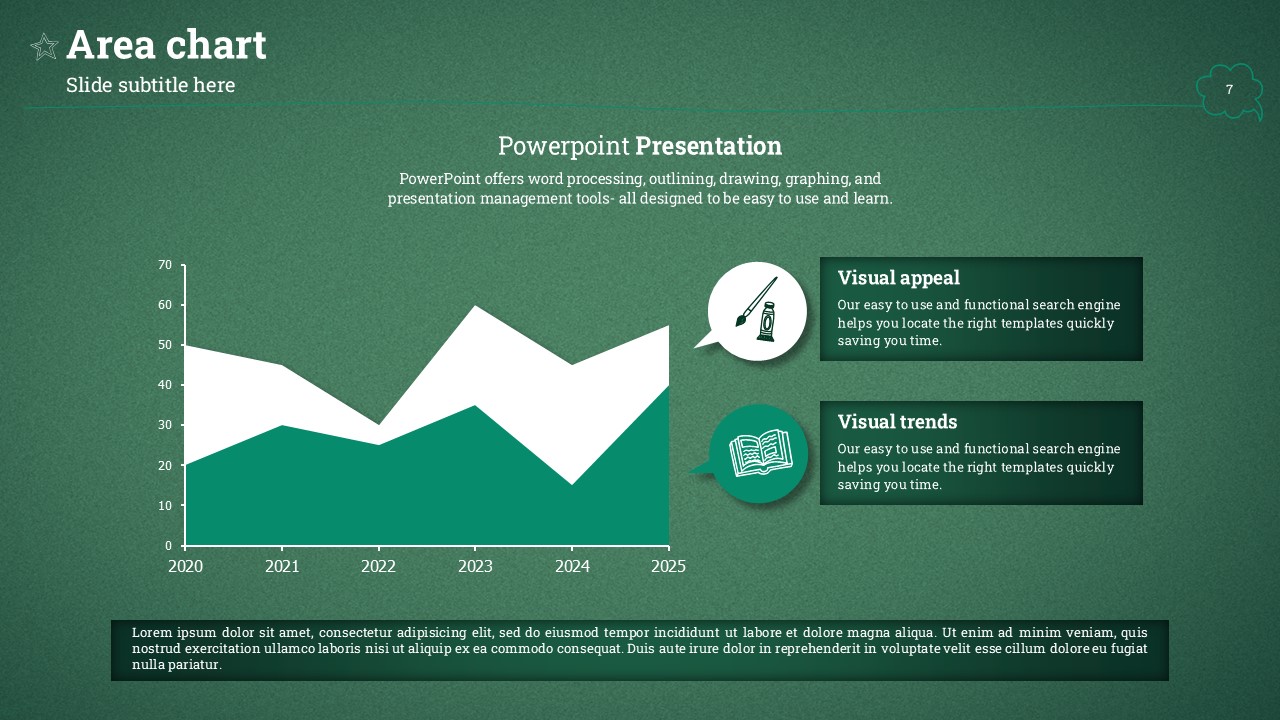
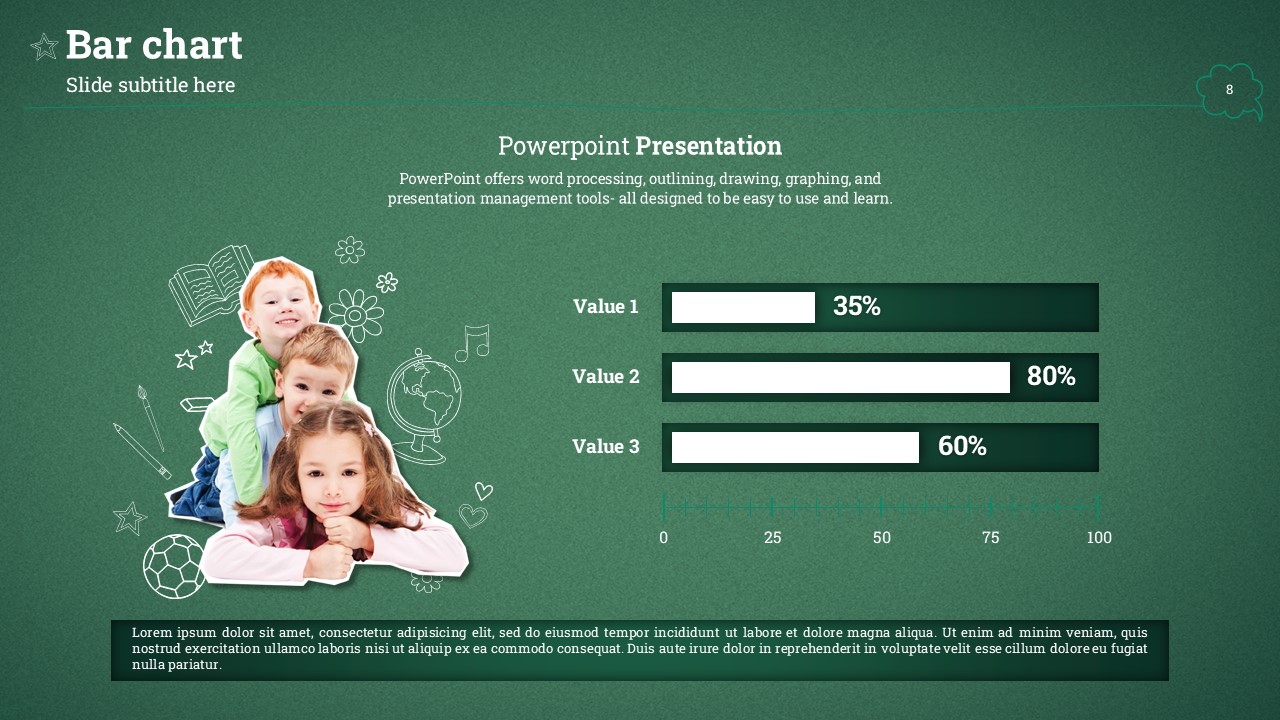
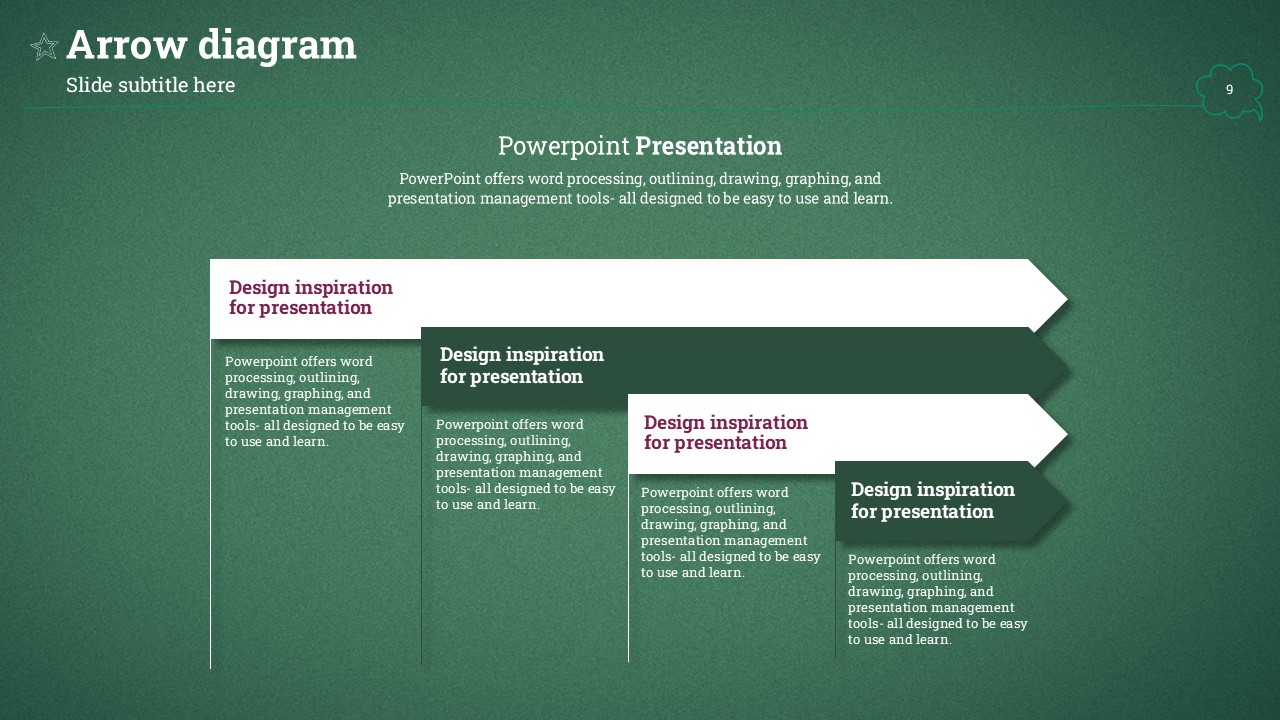
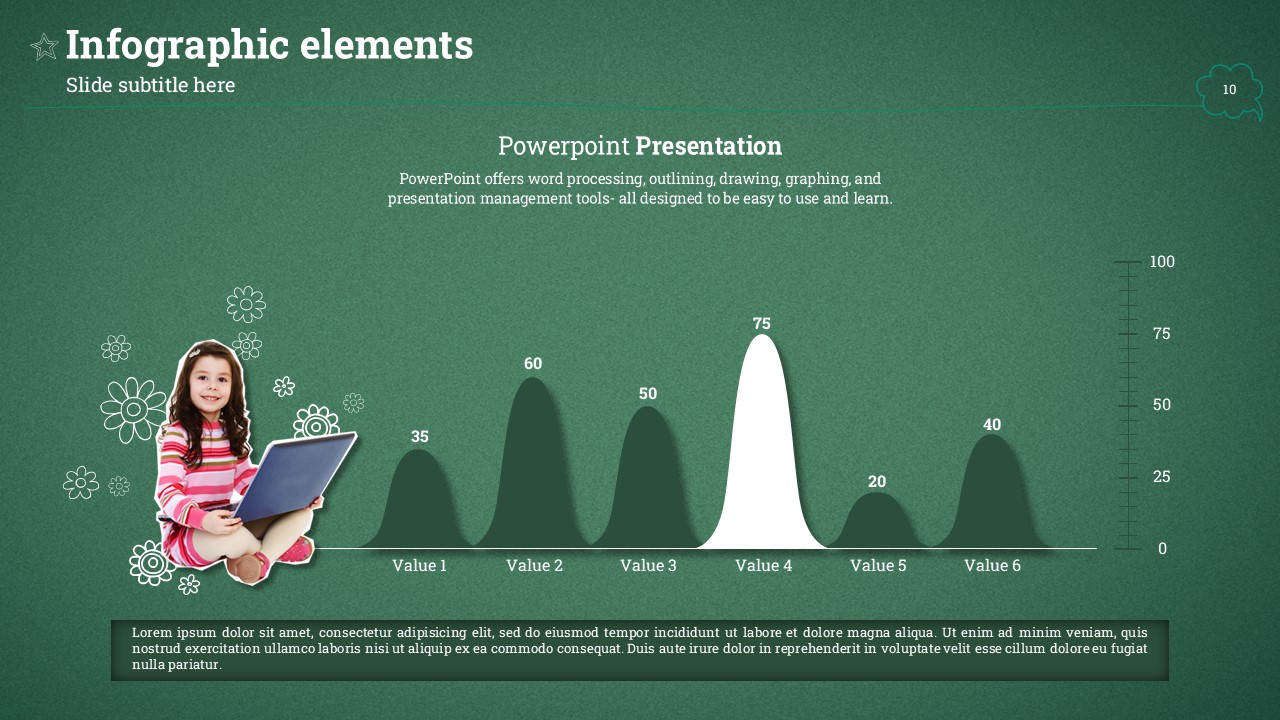
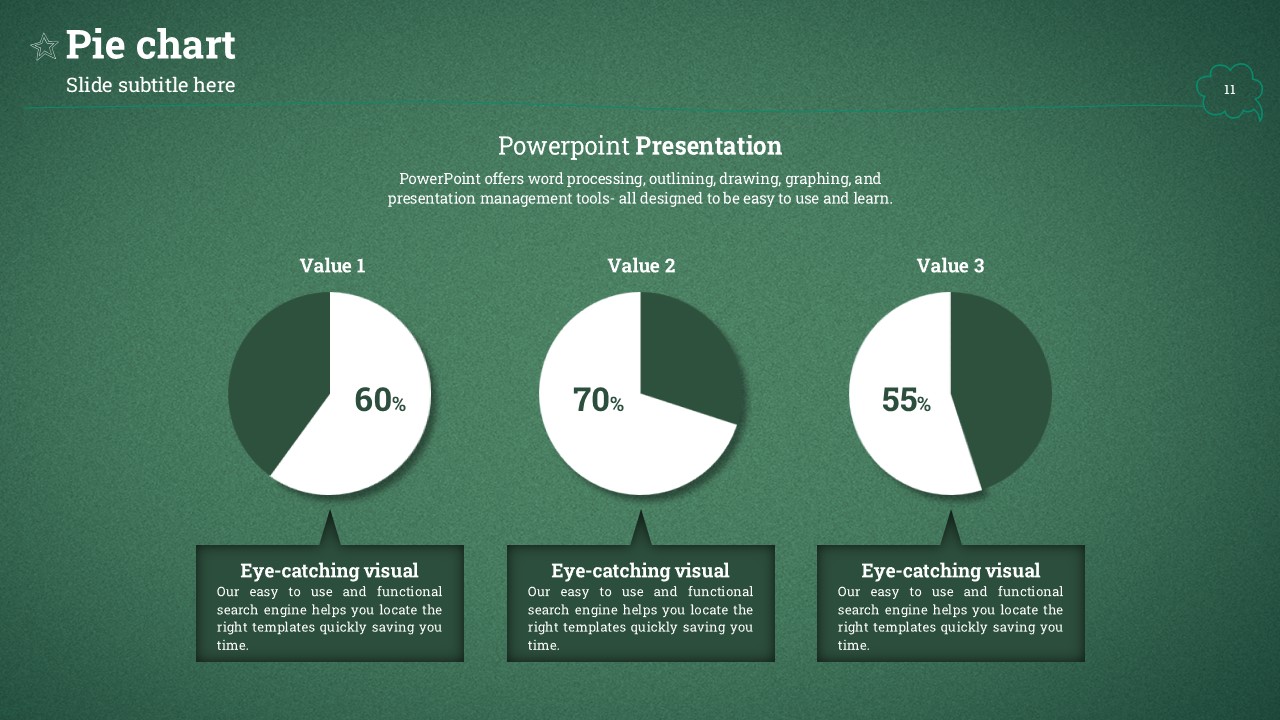
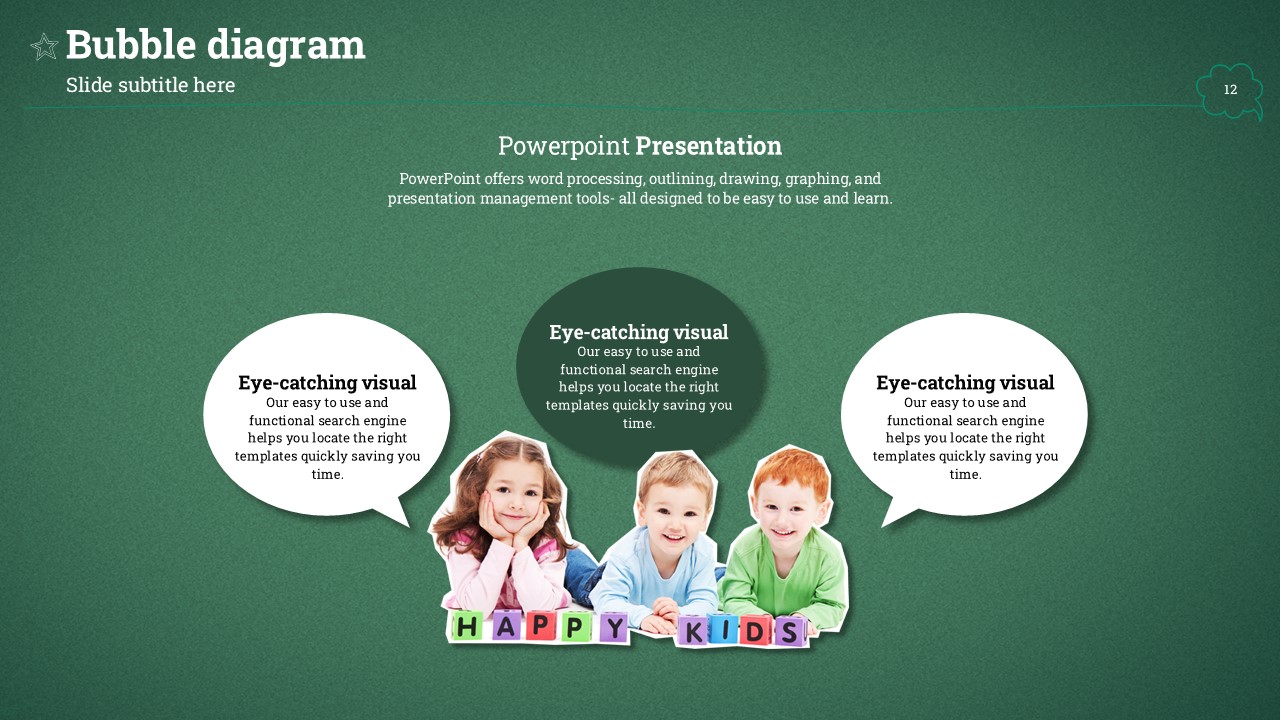
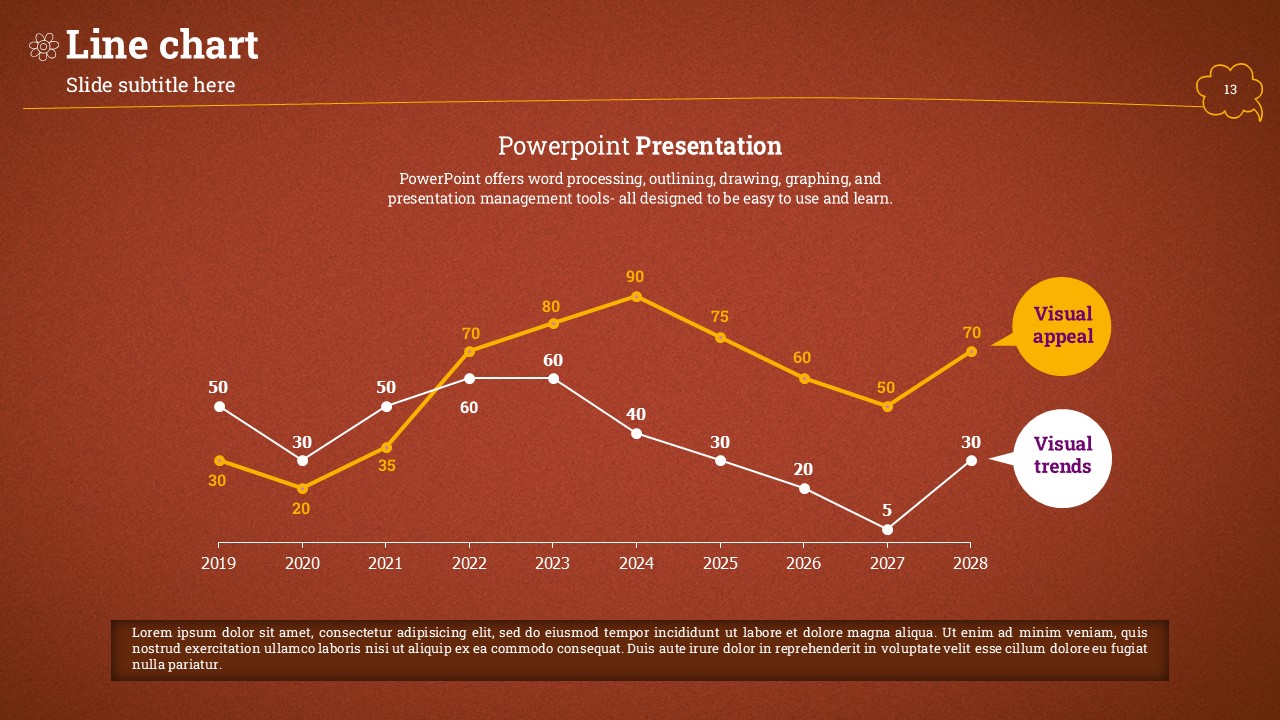
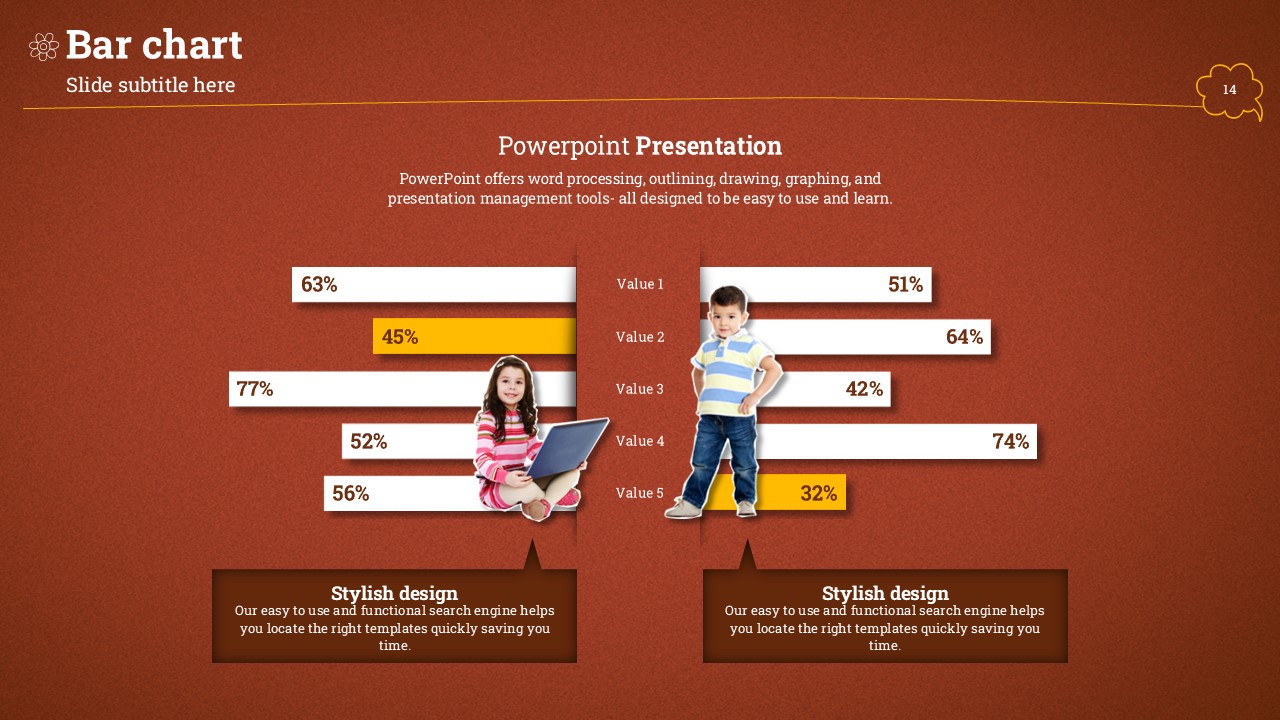
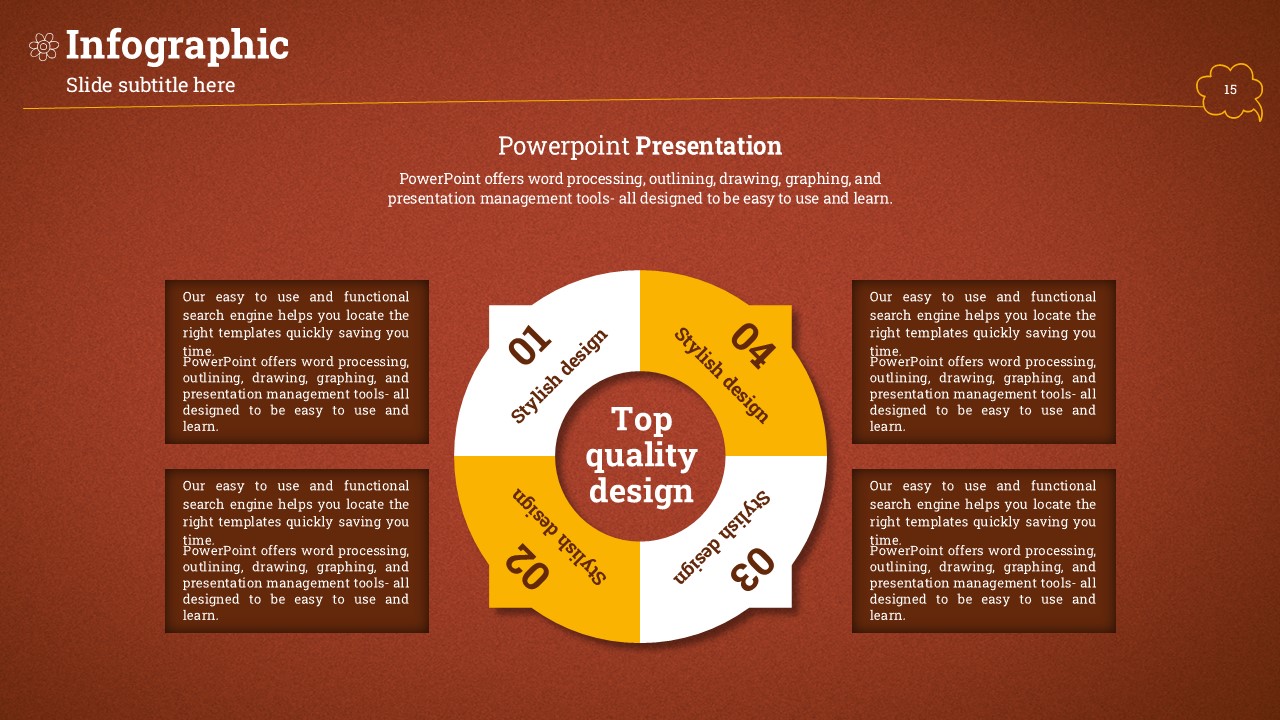
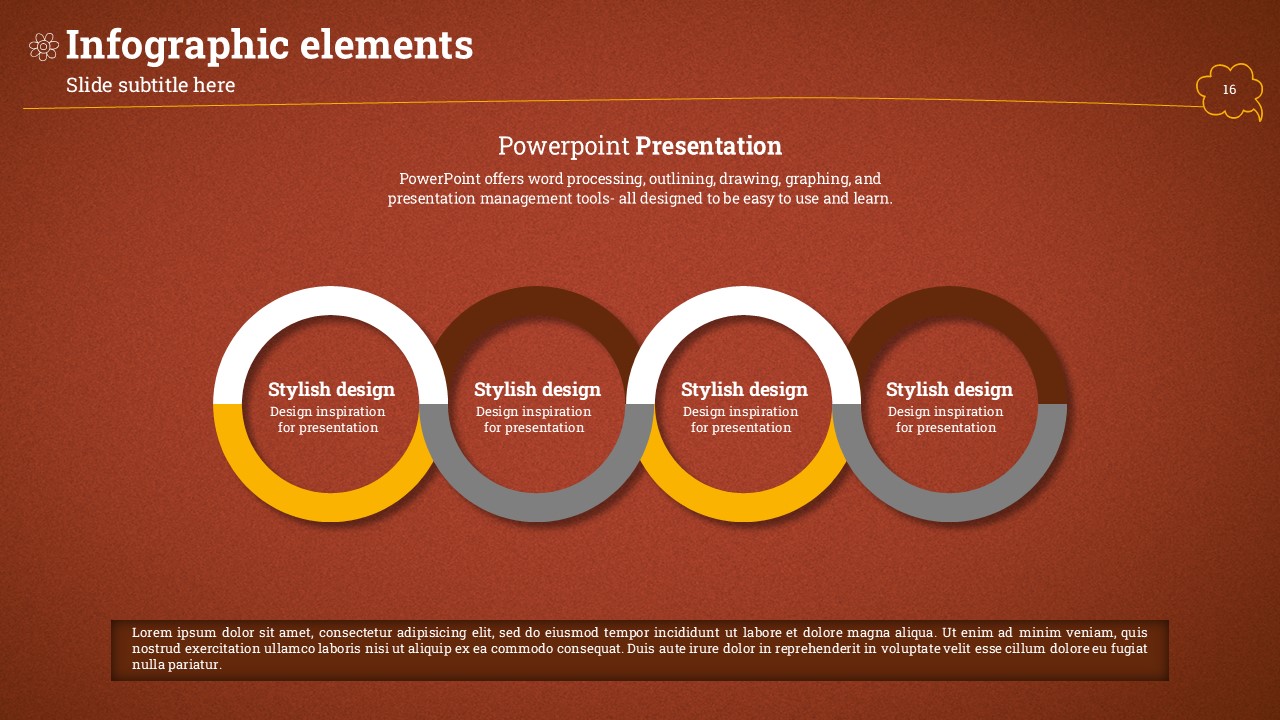
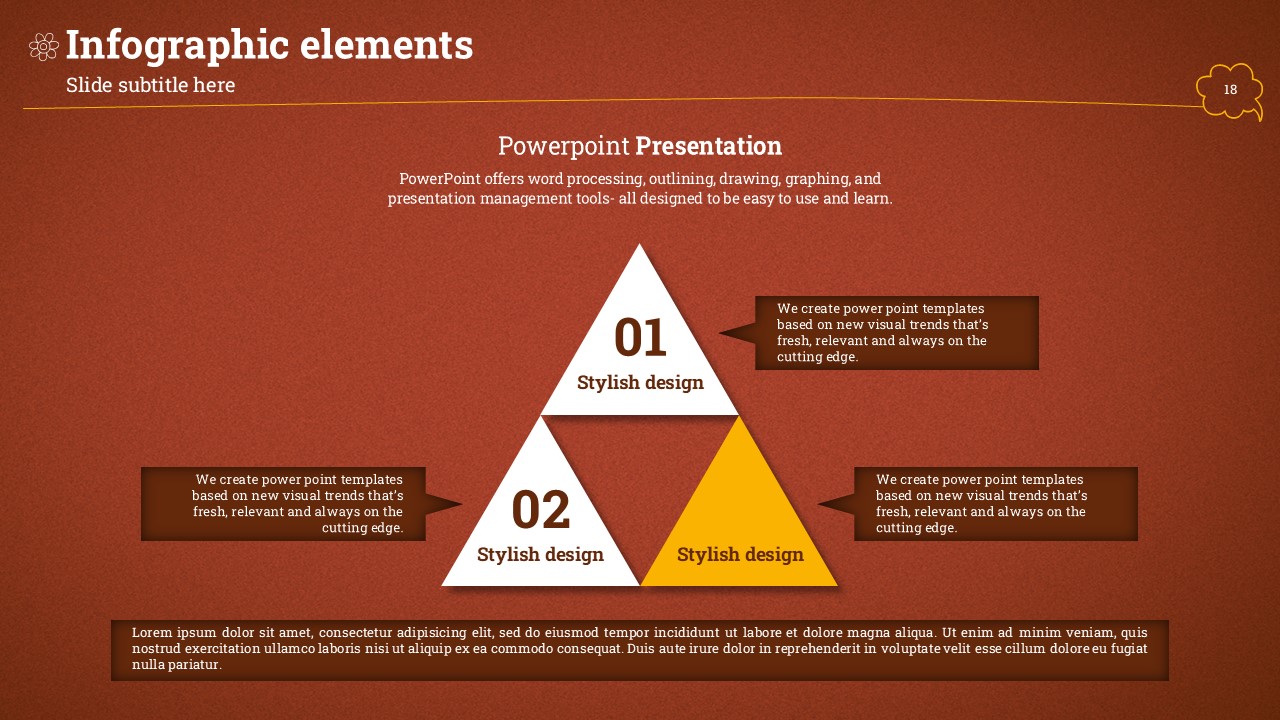
This education-focused PowerPoint template features a chalkboard green textured background combined with children photo cutouts and chalk doodle-style icons, creating a warm and engaging classroom atmosphere. The 20-slide presentation deck includes a title slide, index, infographic layout, bar chart, column chart, pie chart, and bubble diagram — covering all the essential slide types needed for educational presentations. The red-brown accent background and white typography ensure clear content delivery, while the playful chalk illustrations and real children photos bring energy and approachability to every slide. Provided in fully editable PPTX format, this template is ready to use for classroom lessons, school event announcements, educational program introductions, and learning material presentations. Simply replace the placeholder text, data, and images to match your content.
Usage Points
-
Main Usage
Designed for elementary and early childhood education settings, this template is ideal for classroom lesson presentations, school event announcements, and educational program introductions targeting young learners.
-
How to Use
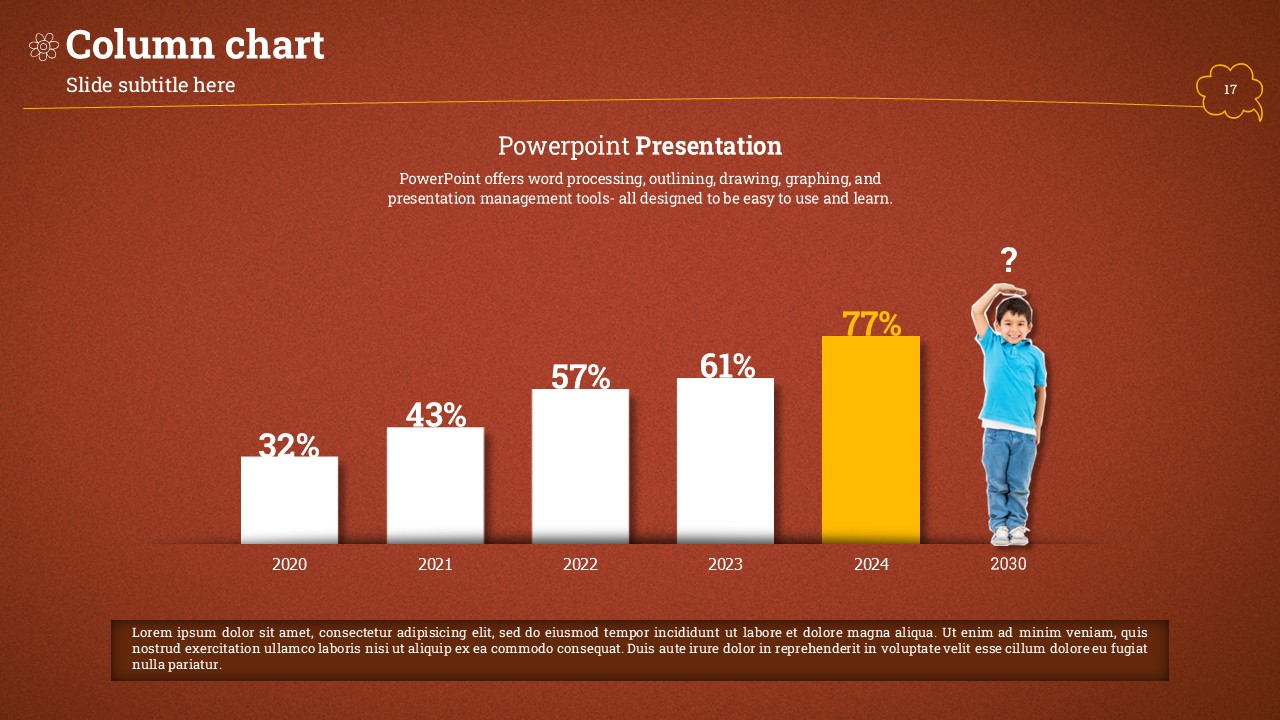
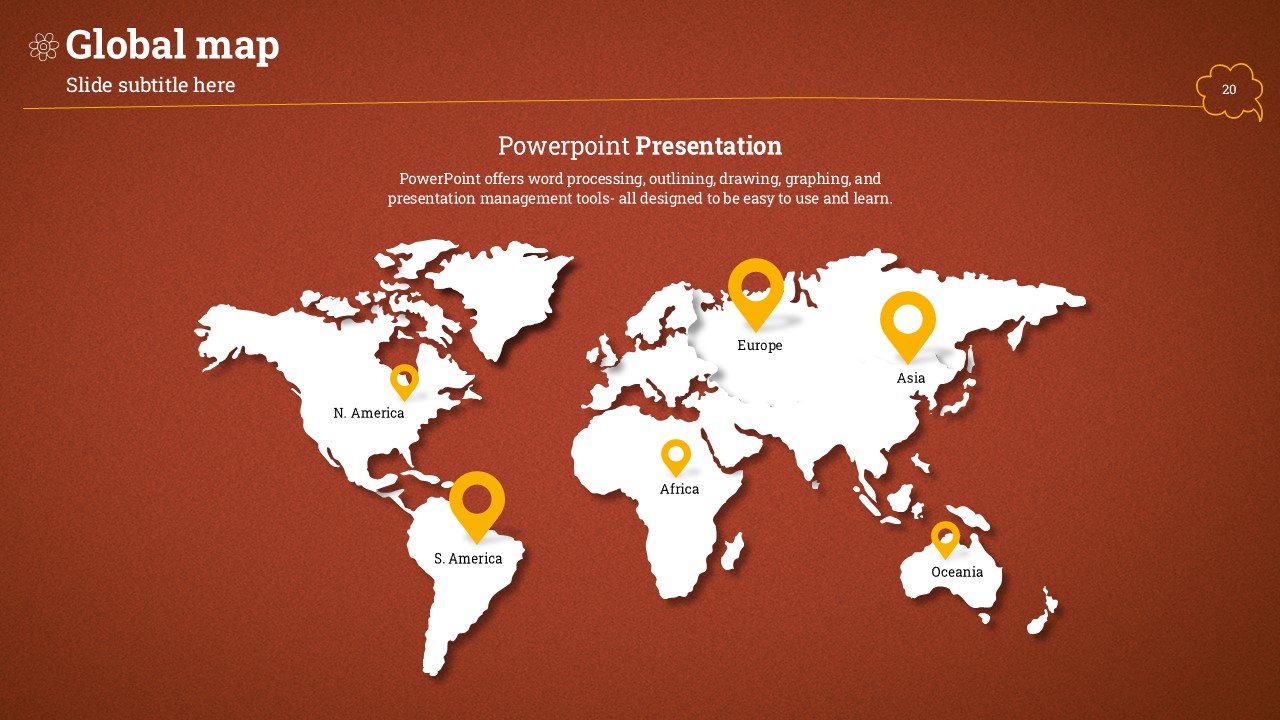
Open the PPTX file and replace placeholder text, numbers, and images with your own educational content. Use the bar chart, pie chart, and bubble diagram slides to visualize learning data, statistics, and key concepts effectively.
-
Recommended For
Best suited for elementary school teachers, kindergarten educators, education content creators, tutoring center instructors, and coordinators running children's educational programs who need engaging visual presentation materials.
-
Slide Structure
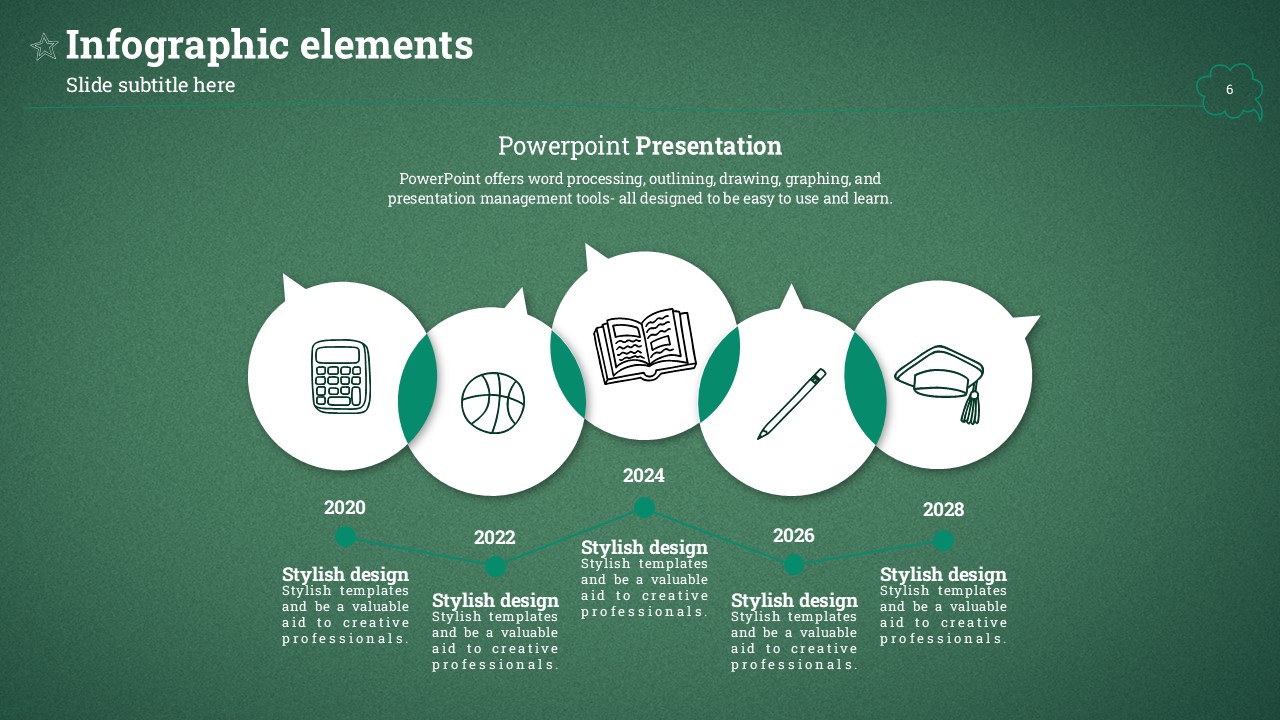
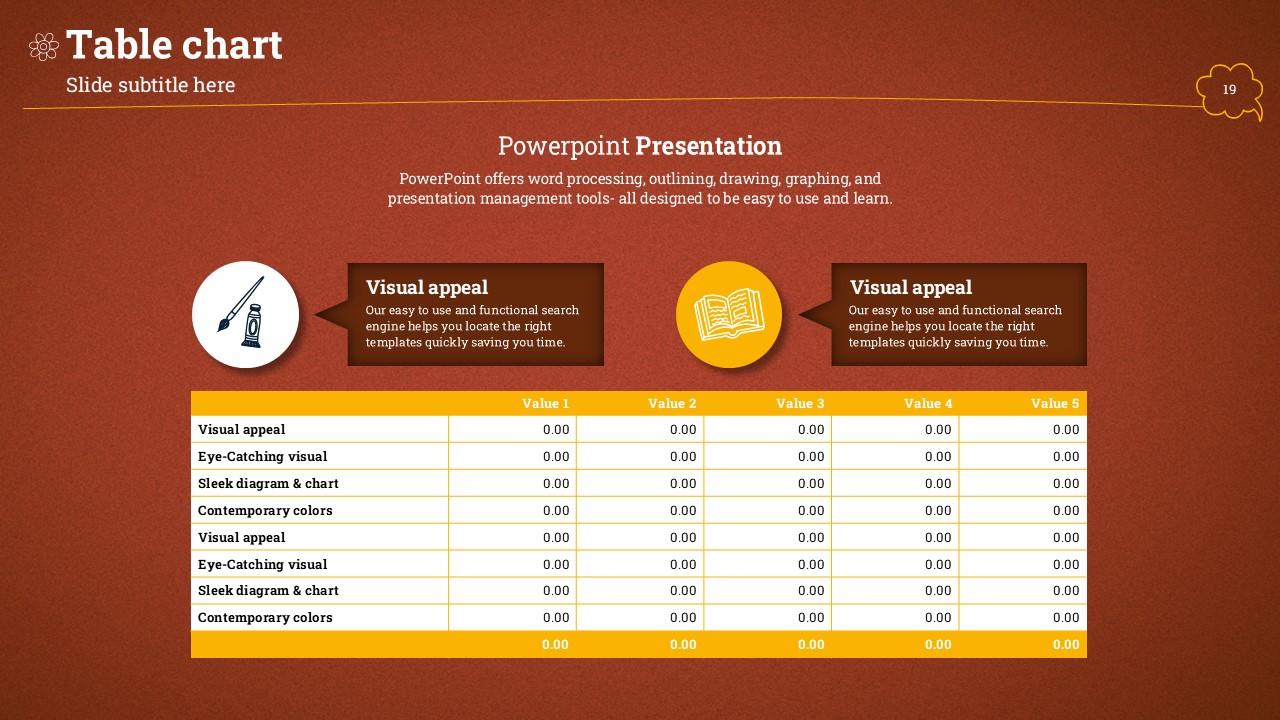
The 20-slide deck includes a title slide, 4-item index, icon-based infographic, horizontal bar chart, column chart with yearly data, three donut-style pie charts, and a bubble diagram — with alternating chalkboard green and red-brown backgrounds throughout.
Related Products
-

Fun School Life PowerPoint – Creative Design Ideal for Educational Materials
#Education
-

Camera Review Presentation Template – Stylish Design
#Education
-

Homework PowerPoint Wide Template – Ideal Design for Education
#Education
-

Creative Presentation Wide – Perfect for Educational and Creative Presentations
#Education
