Future Outlook Line Chart – Market and Competitive Analysis
RJ0500014_12
- Last Update 06/10/2025
- File Size 6.1MB
- # of Slides 2
- File Format PPTX
- Slide Ratio 16:9
- Color
Keywords
About the Product
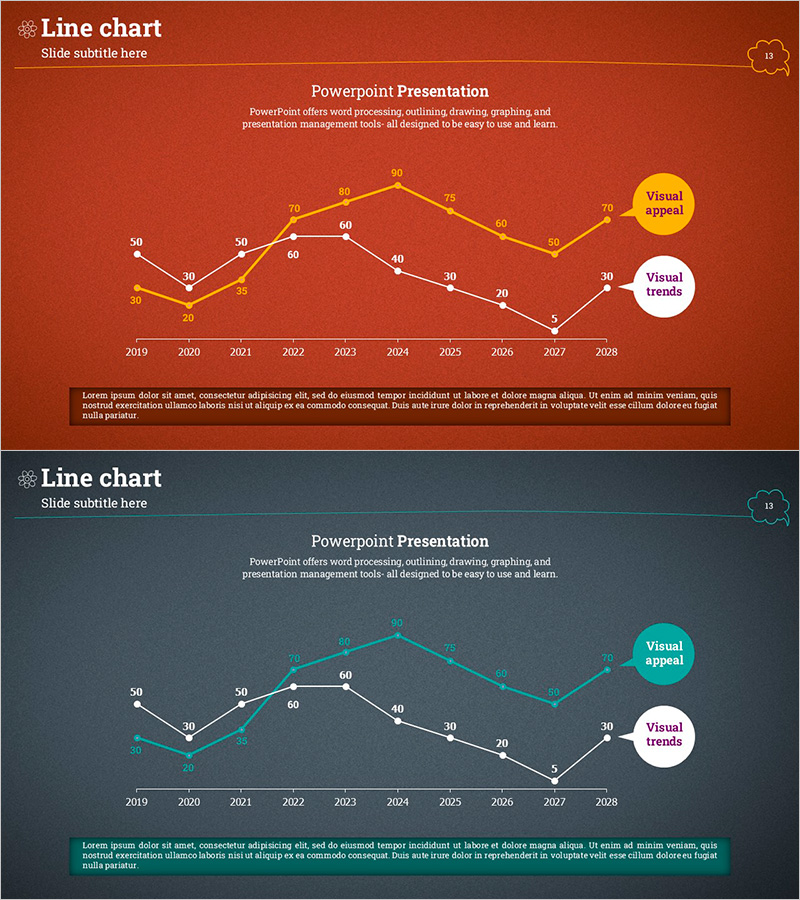
A dual-line chart PowerPoint slide visualizing market trends and competitive performance from 2019 to 2028. Orange and white lines distinguish two data series, with 'Visual appeal' and 'Visual trends' labels positioned on the right to highlight key insights. The rust brown background with gold accent lines enhances presentation credibility. All data points are fully editable, making this slide ideal for market analysis and competitive advantage strategy presentations.
Usage Points
-
Main Usage
Compares market conditions and competitor performance over time using two simultaneous trend lines. Clearly illustrates relative performance differences and provides data-driven evidence for future outlook and strategic decision-making.
-
How to Use
Insert into IR materials, business plans, or market analysis reports in the competitive advantage section. Update yearly data points and modify legend labels ('Visual appeal', 'Visual trends') to reflect actual metrics relevant to your analysis.
-
Recommended For
Strategy planners, marketing teams, finance departments, and executives presenting market analysis to senior management, investors, or business partners. Particularly effective when emphasizing competitive positioning and market share evolution.
-
Slide Structure
Title area (top), subtitle text (upper-middle), dual-line chart with data input zones (center), two legend labels (right side), and explanatory text box (bottom). Includes 10-year timeline axis and 0-90 numeric scale.
Related Products
-

THE ROAD Presentation Table & Tied Vertical Bar Graph – Market and Competitor Analysis
#Market and Competitor Analysis #Diagram #Graph
-

Create Line Charts with Rainbow Paper Template
#Market and Competitor Analysis #Graph #Future Outlook
-

Flowering Period Graph – Future Outlook Analysis
#Market and Competitor Analysis #Graph #Future Outlook
-

Marketing Performance and Analysis – Visualizing Results with Graphs
#Market and Competitor Analysis #Graph #Text Box
