Customer Analytics Bar Charts – Data Visualization
RJ0500014_7
- Last Update 06/11/2025
- File Size 6.1MB
- # of Slides 2
- File Format PPTX
- Slide Ratio 16:9
- Color
Keywords
- #Content-Based Slides
- #Design-Based Slides
- #Market and Competitor Analysis
- #Graph
- #Customer Analysis
- #Horizontal Bar
- #Horizontal Bar Chart
- #16:9
- #horizontal bar chart PowerPoint
- #customer analytics slide template
- #data visualization presentation
- #how to create bar chart in PowerPoint
- #comparison chart slide download
About the Product
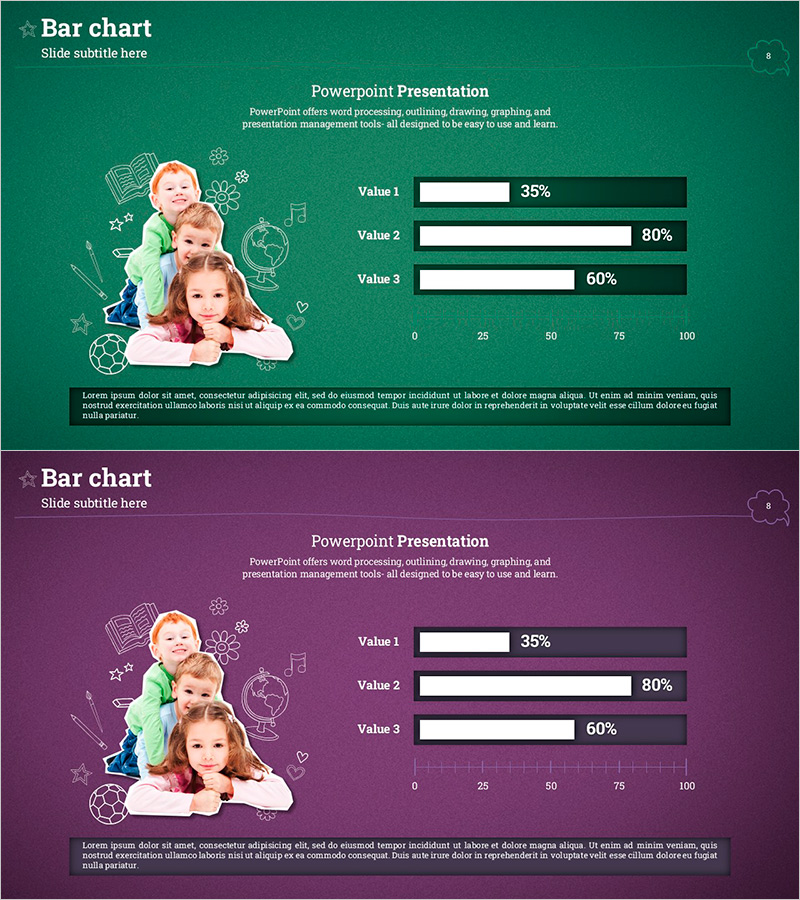
A horizontal bar chart PowerPoint slide designed for customer analytics, market analysis, and performance comparisons. This presentation template displays three data series in horizontal format, enabling clear numerical comparisons across items. Available in two color themes—forest green and deep purple—with percentage-based data visualization on a 0–100 scale. Each slide is fully editable and ready to use in business reports, educational presentations, marketing analysis, and executive briefings.
Usage Points
-
Main Usage
Visualize three data points or categories side-by-side using horizontal bars, making numerical comparisons instantly clear. Ideal for percentage-based metrics, ranking comparisons, and performance analysis where horizontal layout improves readability.
-
How to Use
Replace the Value 1, 2, and 3 labels with your own data categories and update the percentage values. Choose between the green or purple color theme to match your brand identity. Bar lengths and numbers adjust automatically as you edit the data.
-
Recommended For
Marketing teams analyzing customer segments, sales departments comparing performance metrics, executive dashboards, market research presentations, and educational institutions tracking progress. Suitable for any data-driven business presentation requiring clear numerical comparisons.
-
Slide Structure
Two-slide set featuring identical chart layouts in forest green and deep purple themes. Each slide contains three horizontal bars with value labels, percentage numbers, a 0–100 scale axis, and a text description area for context or insights.
Related Products
-

Customer and Market Analysis Slide – Yellow and Bluegreen Emotion
#Market and Competitor Analysis #Graph #Other
-

Modern Business Presentation Template Map – Global Marketing Analysis
#Market and Competitor Analysis #Marketing Plan and Strategy #Graph
-

Space Industry Analysis Graph Chart – Market and Competitive Analysis
#Market and Competitor Analysis #Graph #Customer Analysis
-

Work Capabilities Analysis Diagram – Analysis of Key Personnel Work Performance
#Company Introduction #Market and Competitor Analysis #Diagram
