Study Area Chart - Market Status and Competitive Advantage
RJ0500014_6
- Last Update 06/11/2025
- File Size 5.7MB
- # of Slides 2
- File Format PPTX
- Slide Ratio 16:9
- Color
Keywords
About the Product
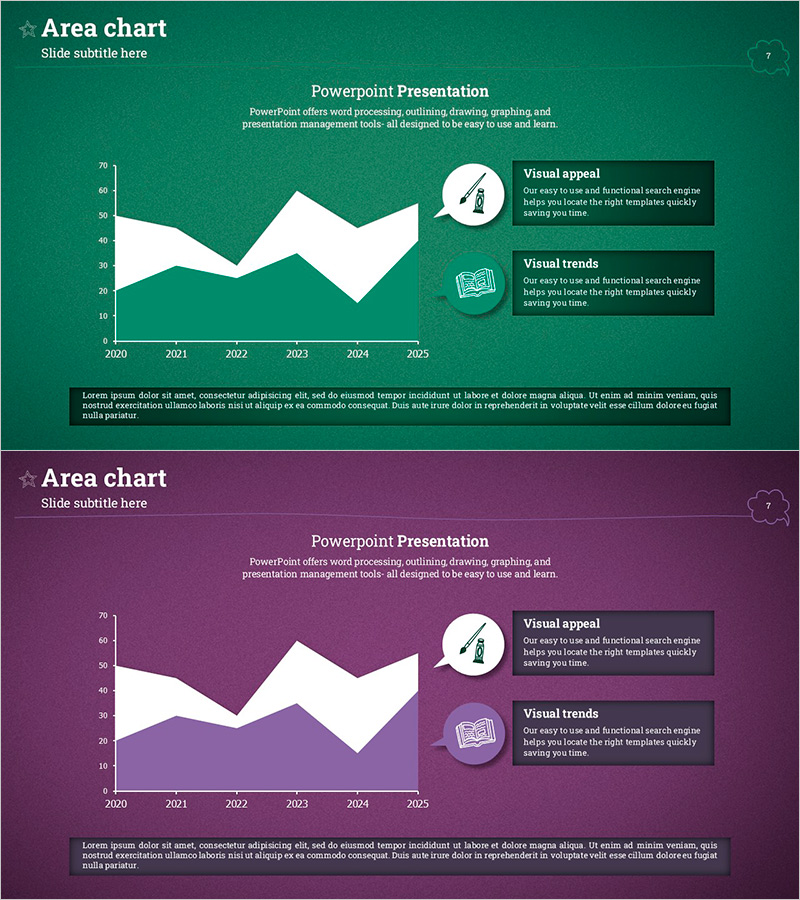
A professional area chart PowerPoint slide for comparing market status and competitive advantage at a glance. This 2-slide set features green and purple backgrounds with white area graphs that clearly visualize data trends. The left side displays Y-axis values (0–70) and X-axis years (2020–2025) to show growth over time, while the right side includes two icon callouts with text boxes for key messaging. Instantly applicable to presentation decks, business reports, and marketing plans for market analysis sections.
Usage Points
-
Main Usage
Visualize market analysis data through area charts to compare growth trends and competitive advantage over time. Supports data-driven decision-making for investor pitches, executive briefings, and marketing strategy development.
-
How to Use
Input actual market data into the left area chart and add key insights (market size, growth rate, competitive positioning) in the right text boxes. Choose between green or purple backgrounds to match your corporate brand colors and maintain consistency across your presentation.
-
Recommended For
Ideal for business plans, investment pitch decks, quarterly business reviews, and marketing strategy presentations. Recommended for market analysis sections where market overview, competitor comparison, and growth forecasts are essential for executive, investor, and partner presentations.
-
Slide Structure
Two-slide layout with Y-axis numeric scale, X-axis year labels, white area graph, two right-side icons (visual appeal and visual trends) plus two text boxes per slide. Four editable text areas allow flexible information customization and data integration.
Related Products
-

2 Versions of the Green Area Chart – Market Analysis and Competitive Edge
#Market and Competitor Analysis #Graph #Other
-

The Importance of Modern People's Health Care – Insights from Market Analysis
#Market and Competitor Analysis #Graph #Other
-

Natural Landscape Illustration Graph – Market Status and Competitive Advantage
#Market and Competitor Analysis #Graph #Other
-

Meat and Vegetable Consumption by Region – Market Status Analysis
#Market and Competitor Analysis #Graph #Other
