Pie Chart and Detailed Explanation – Visualizing Market Share
RJ0500014_10
- Last Update 06/10/2025
- File Size 5.7MB
- # of Slides 2
- File Format PPTX
- Slide Ratio 16:9
- Color
Keywords
About the Product
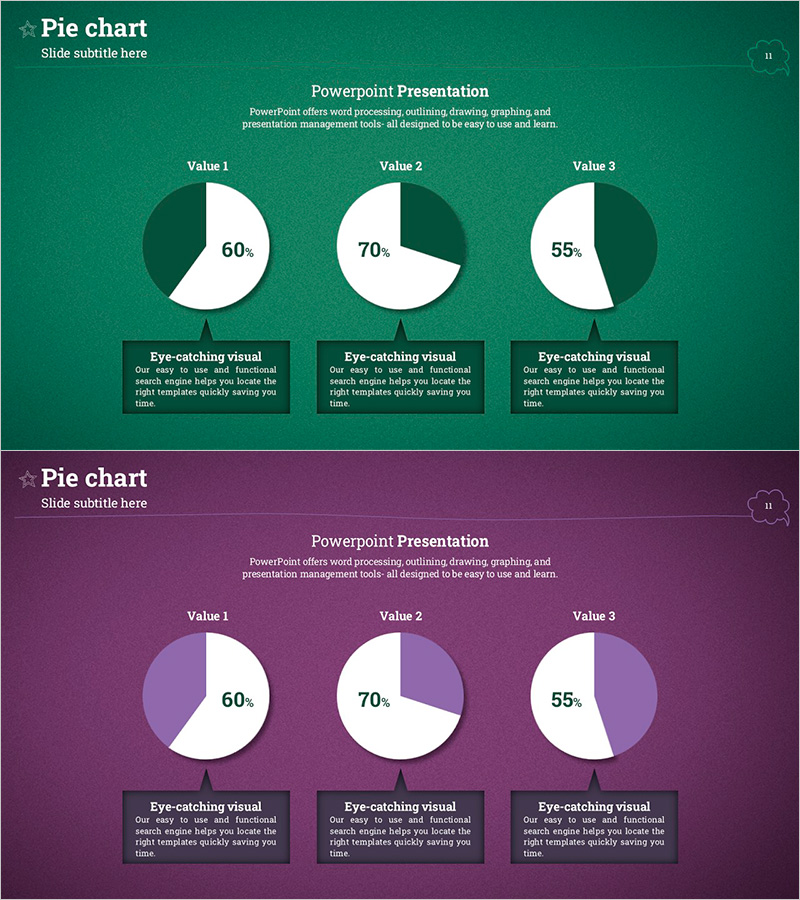
A PowerPoint slide deck optimized for market analysis and competitive comparison using pie chart visualization. Three circular graphs display proportional data clearly, available in two color themes: dark green and purple. Each chart includes a detailed explanation text box below for contextual insights alongside numerical values. Formatted in 16:9 widescreen with 2 slides, fully editable in PPTX format. Ideal for presenting market share, revenue composition, customer distribution, and other ratio-based data in business presentations.
Usage Points
-
Main Usage
Visualize ratio-based data such as market analysis, competitive positioning, revenue breakdown, and customer distribution across three comparable segments. The explanation text boxes below each pie chart allow you to present numerical values alongside key insights and interpretations.
-
How to Use
Replace the percentage values (60%, 70%, 55%) with your actual data, and update the text boxes with item names and detailed descriptions. Choose between dark green or purple theme to match your presentation's visual identity and corporate branding.
-
Recommended For
Marketing professionals, executives, data analysts, and consultants presenting market reports, business performance analysis, and strategic planning. Suitable for quarterly earnings presentations, investor briefings, and internal management meetings.
-
Slide Structure
Three pie charts arranged horizontally, each divided into two segments. Title and descriptive text at the top, three pie charts in the center, and detailed explanation text boxes for each item at the bottom. Two color theme options provided: dark green and purple.
Related Products
-

Development Status Analysis Circle Graph
#Product/Service Introduction #Market and Competitor Analysis #Graph
-

Development Status Pie Chart – Visualizing Market Share
#Product/Service Introduction #Market and Competitor Analysis #Graph
-

Pie Chart by User – Customer Analysis and Market Share
#Market and Competitor Analysis #Graph #Customer Analysis
-

Market Share Analysis Graph & Table – Enhancing Understanding through Data Visualization
#Product/Service Introduction #Market and Competitor Analysis #Diagram
